
To help investors, founders, and employees make decisions and benchmark past performance, Carta regularly shares insights from our private market data. Here’s what we saw in 2021:
-
An astonishing new high in rounds and money raised.The number of rounds on the Carta platform increased 31% over 2020, and the total amount of capital more than doubled. This larger amount of capital landed in both more deals and larger ones. The volume of deals and capital are up in every sector and stage, as well as across geographies.
-
Is healthcare the new SaaS? While all sectors saw a jump this past year, health and biotech for the second year in a row raised more than any other sector—including software as a service—in seed through Series C rounds.
-
The “Great Resignation” for tech startups may be slowing.Employee-initiated terminations dropped throughout the last quarter. While 86% of terminations in Q3 were voluntary, that number dropped to 82% for Q4.
Why did 2021 perform the way it did?Much of this staggering growth was driven by the overall availability of capital prompted by many factors. Low interest rates tend to drive a search for places for capital to be invested. Venture capital has delivered high returns in recent years, which has prompted some funds to begin or increase allocations to this asset class. It may also be that after slower growth in 2020, we’re seeing the result of temporary pent-up demand for investments. Finally, the remarkable maturation of healthcare technologies—both pandemic-related and otherwise—may also have played a role.
What can we see for 2022?Within this record-setting year, there may already be signs of a correction. Venture funding has fallen for two successive quarters. Q4 saw 20% fewer deals and 5% less cash than Q2. We’ll continue to watch these numbers in 2022 to see whether this is a sign of a lasting shift in the market.
2021: Strongest year on record
Rounds and cash raised
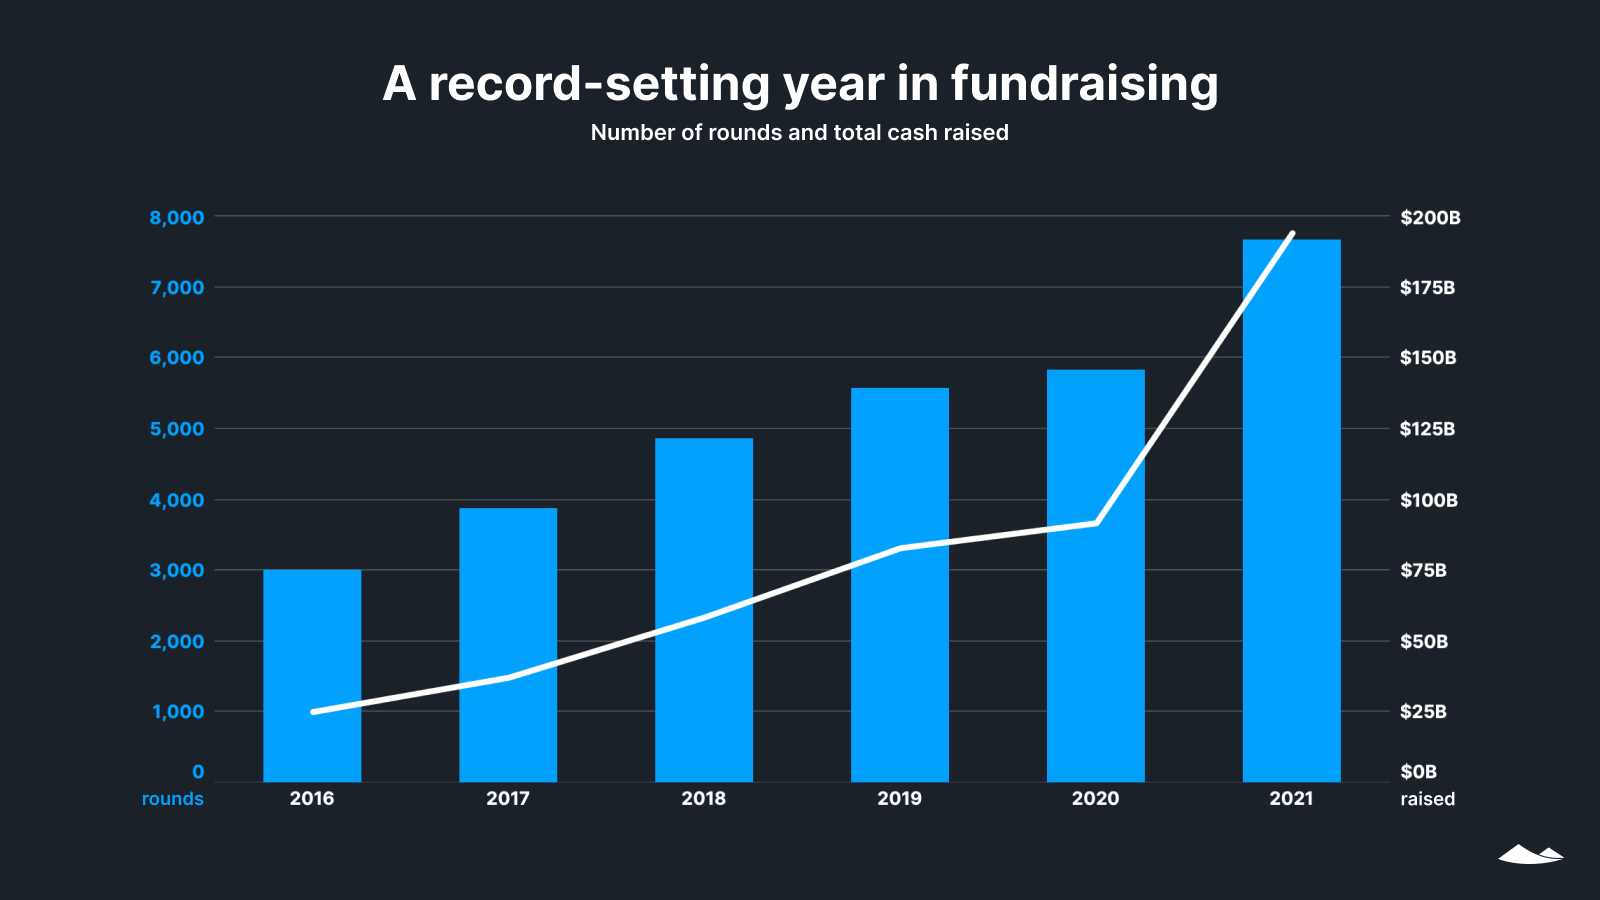
Although the number of deals and amount of cash raised by companies on the Carta platform have increased each year since 2016, both accelerated this past year. The total amount of venture investments skyrocketed by 111%, from $92B to $194B. That $102B jump from 2020 to 2021 is larger than the growth of $67B over the previous four years combined.
The number of deals also increased from under 6,000 in 2020 to over 7,500 in 2021. That’s a 31% increase compared with an average of 19% per year over the four preceding years.
This explosive growth follows a more muted rate of annual growth in 2020, which saw increases of 11% in cash and 5% in the number of deals over the previous year.
Cash raised by industry
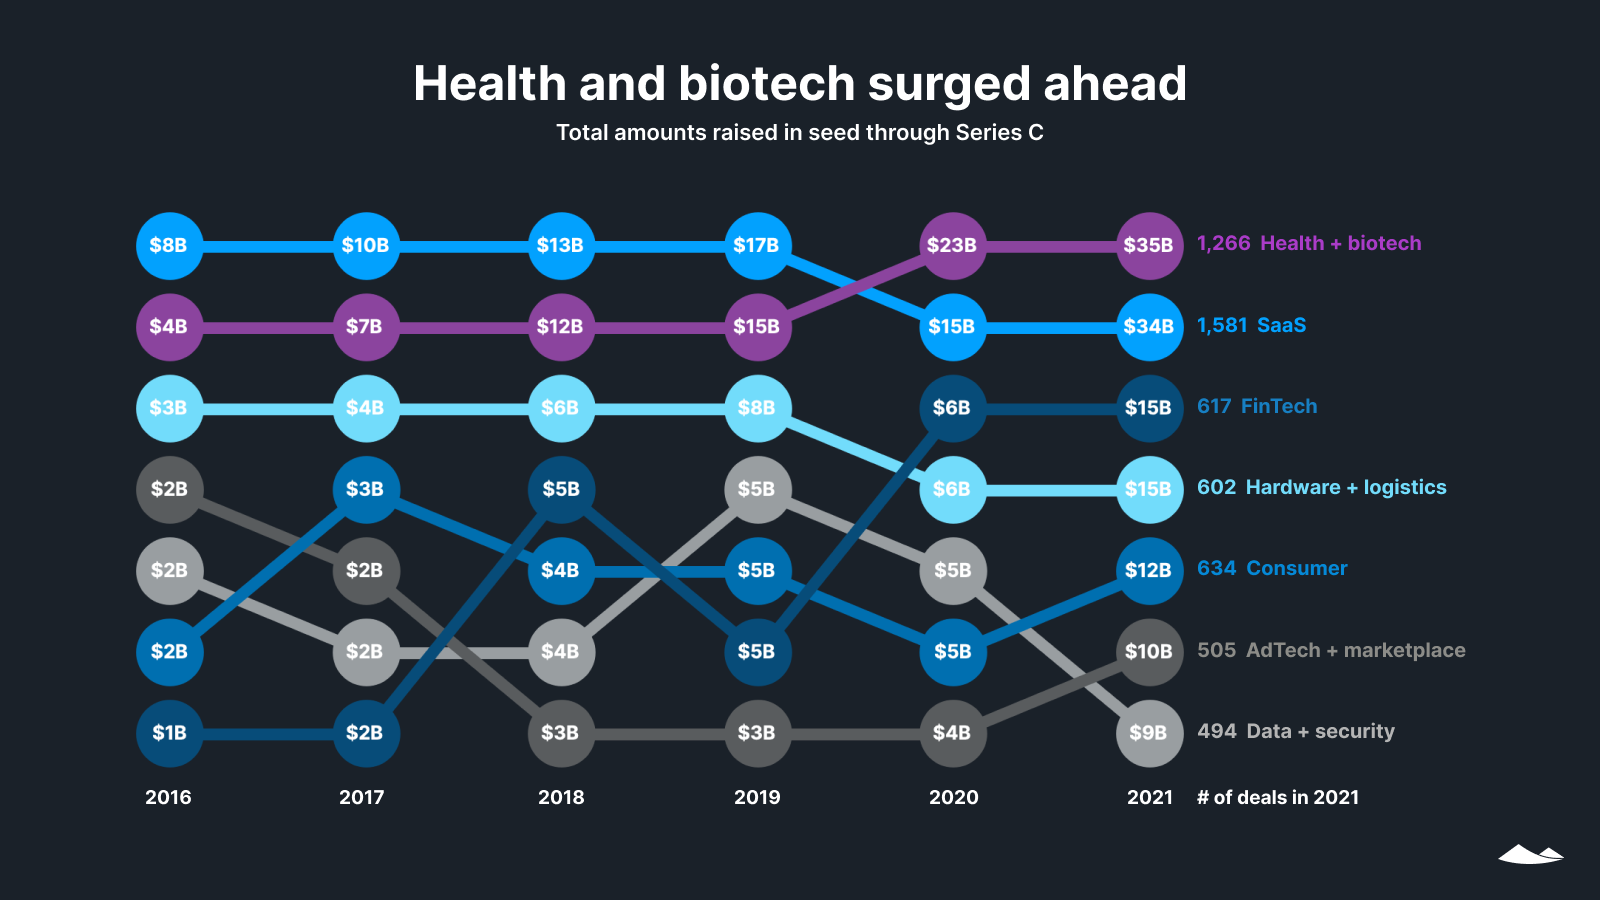
Every sector saw a jump in funding in 2021, but the largest amount of money poured into health, healthtech, and biotech. With fewer deals but a larger average deal size, this sector outpaced software as a service (SaaS) in early-stage funding for the second consecutive year.
Pandemic-time interest in improving healthcare technology and processes fueled part of this growth. Other investments are tied to longer-term changes in healthcare technologies and areas of biotech not related to health.
Our quarterly data shows that the trend might be reversing. While seed through Series C health and biotech funding outpaced SaaS from Q1 2020 through Q3 2021, SaaS returned to the top spot in Q4 2021 with $9.3B. That compares with $6.8B for health and biotech in Q4. With the pandemic still an X factor, it remains to be seen what level of funding these areas will continue to attract in 2022.
Deals by state
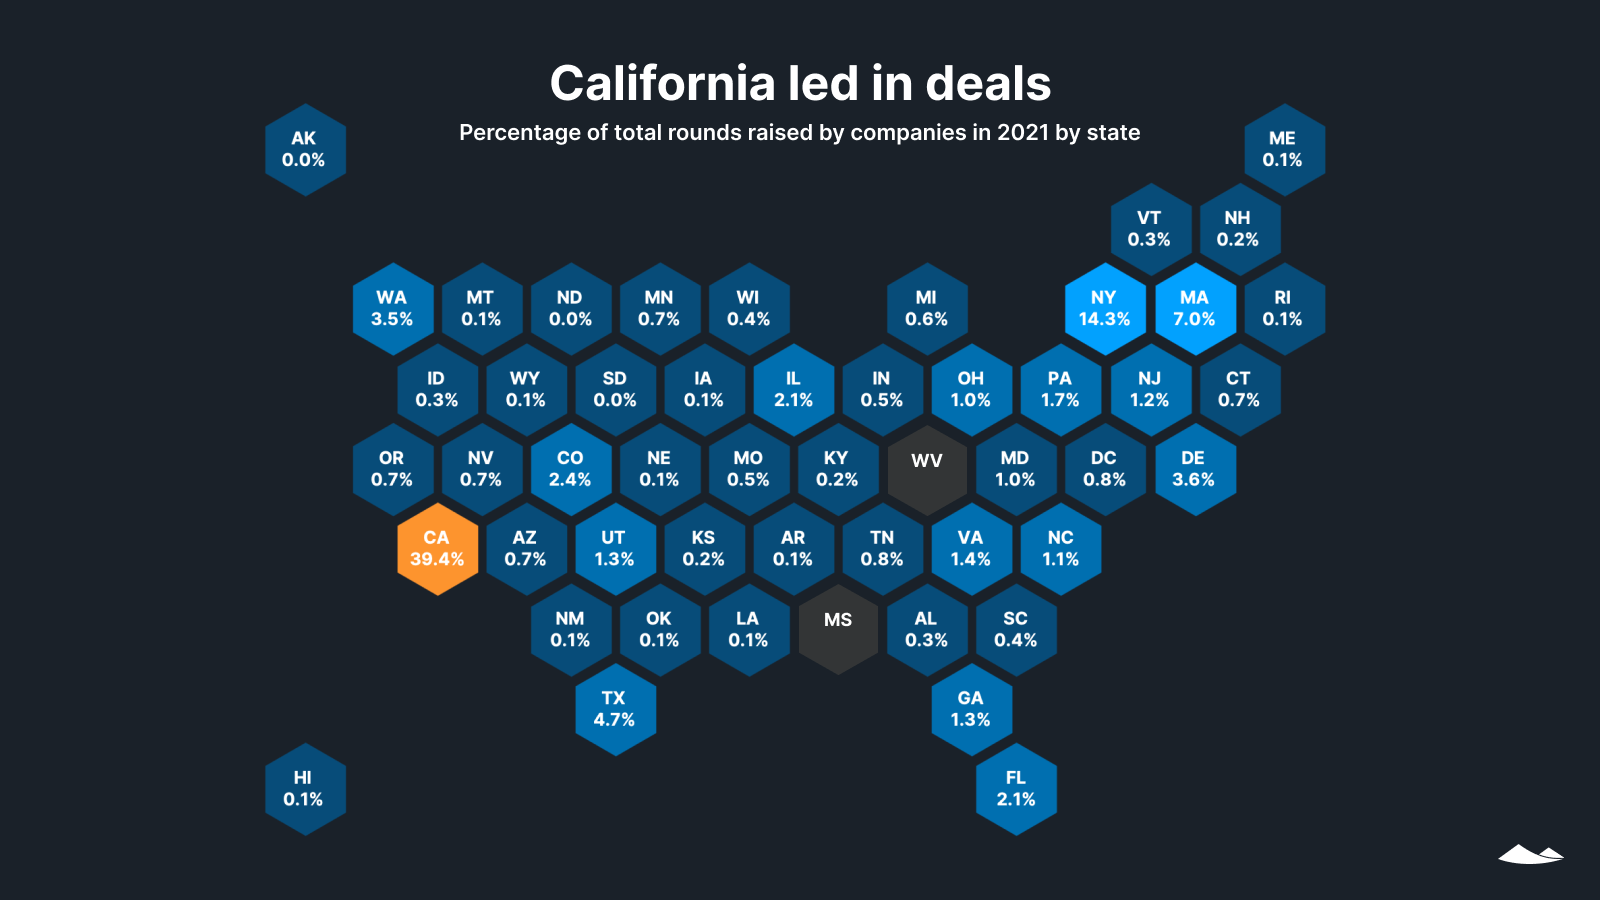
The geography of venture capital doesn’t seem to have changed much over the past five years. In 2021, California was home to companies receiving 47% of total dollars—exactly the same as in 2016.
But that’s not the whole story. While in 2016, California saw 42% of all venture deals, it represented only 39% in 2021. During this time, Texas inched from 4.2% to 4.7% of deals and from 2.9% to 3.1% of capital. Florida bumped up from 1.6% to 2.1% of deals and but slipped from 1.5% to 1.3% of capital.
Given large overall increases in investment in 2021 across the country, these relatively steady percentages translate into a substantial uptick in capital throughout the country. For instance, Florida’s total venture investments grew from $0.4B in 2016 to $2.7B in 2021, even while its percentage of nationwide funding dropped.
Cash raised by stage
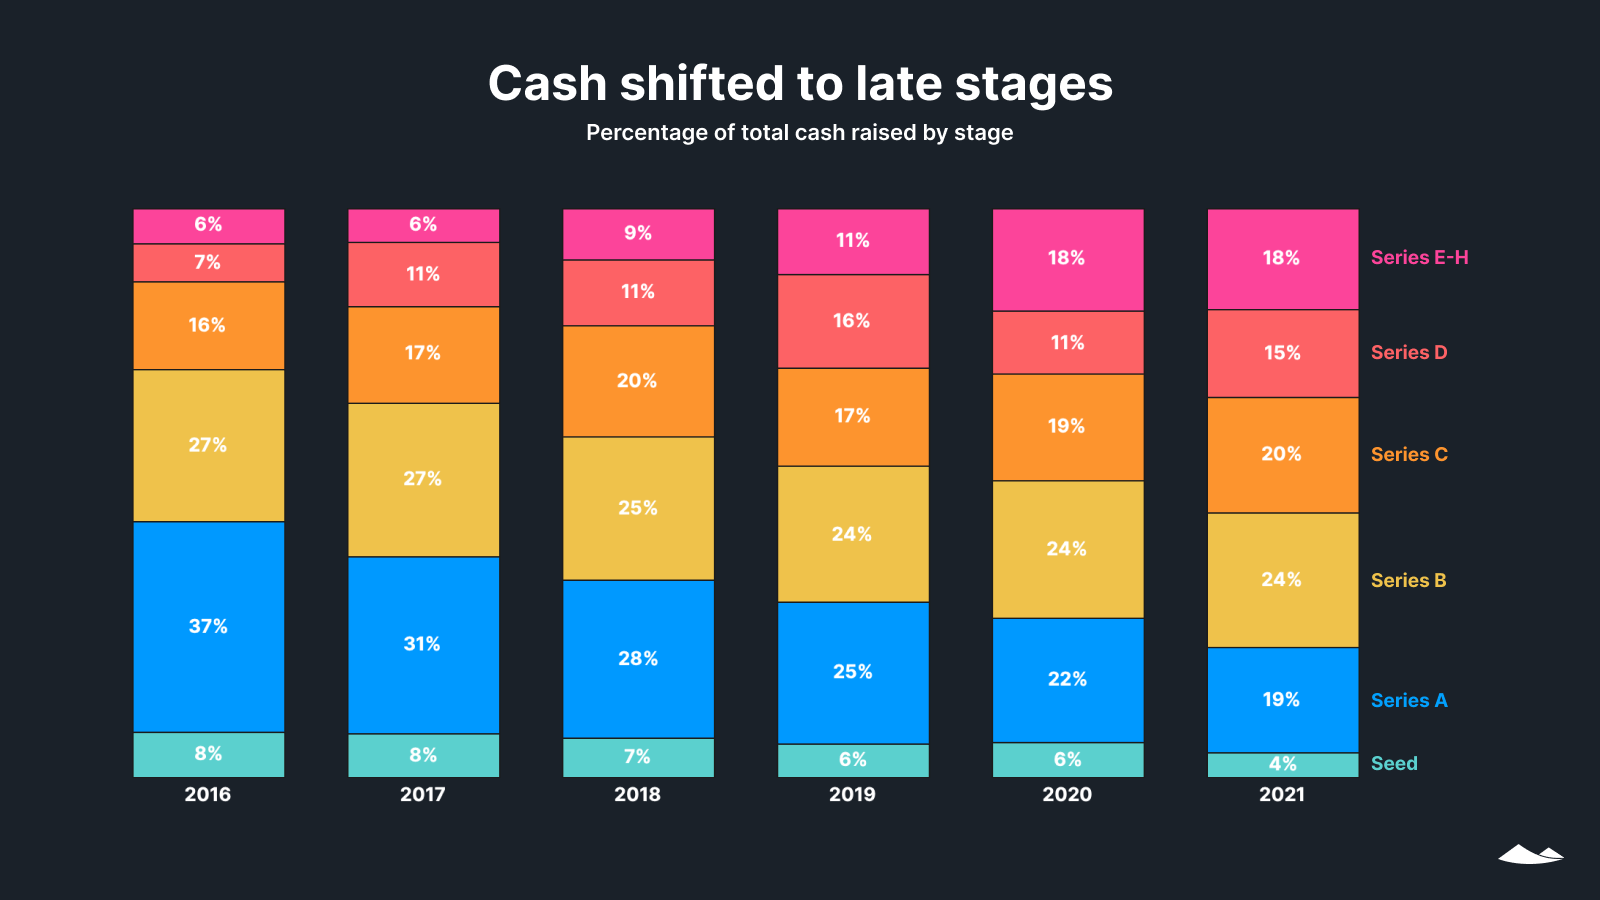
Capital to later-stage companies continued to grow in 2021. The percentage of funding going to companies at Series D and beyond has more than doubled over the last five years—going from 13% to 33%.
The percentage of funding that went to seed and Series A rounds dropped by nearly half in that period, from 45% to 23%. However, the staggering overall increases that we’ve seen in venture capital mean that more cash than ever was available in 2021 to early-stage founders, who are taking a narrower slice of a much larger pie: From 2016 to 2021, the amount going to seed and Series A rounds grew from $11B to $46B.
Percent change in round sizes
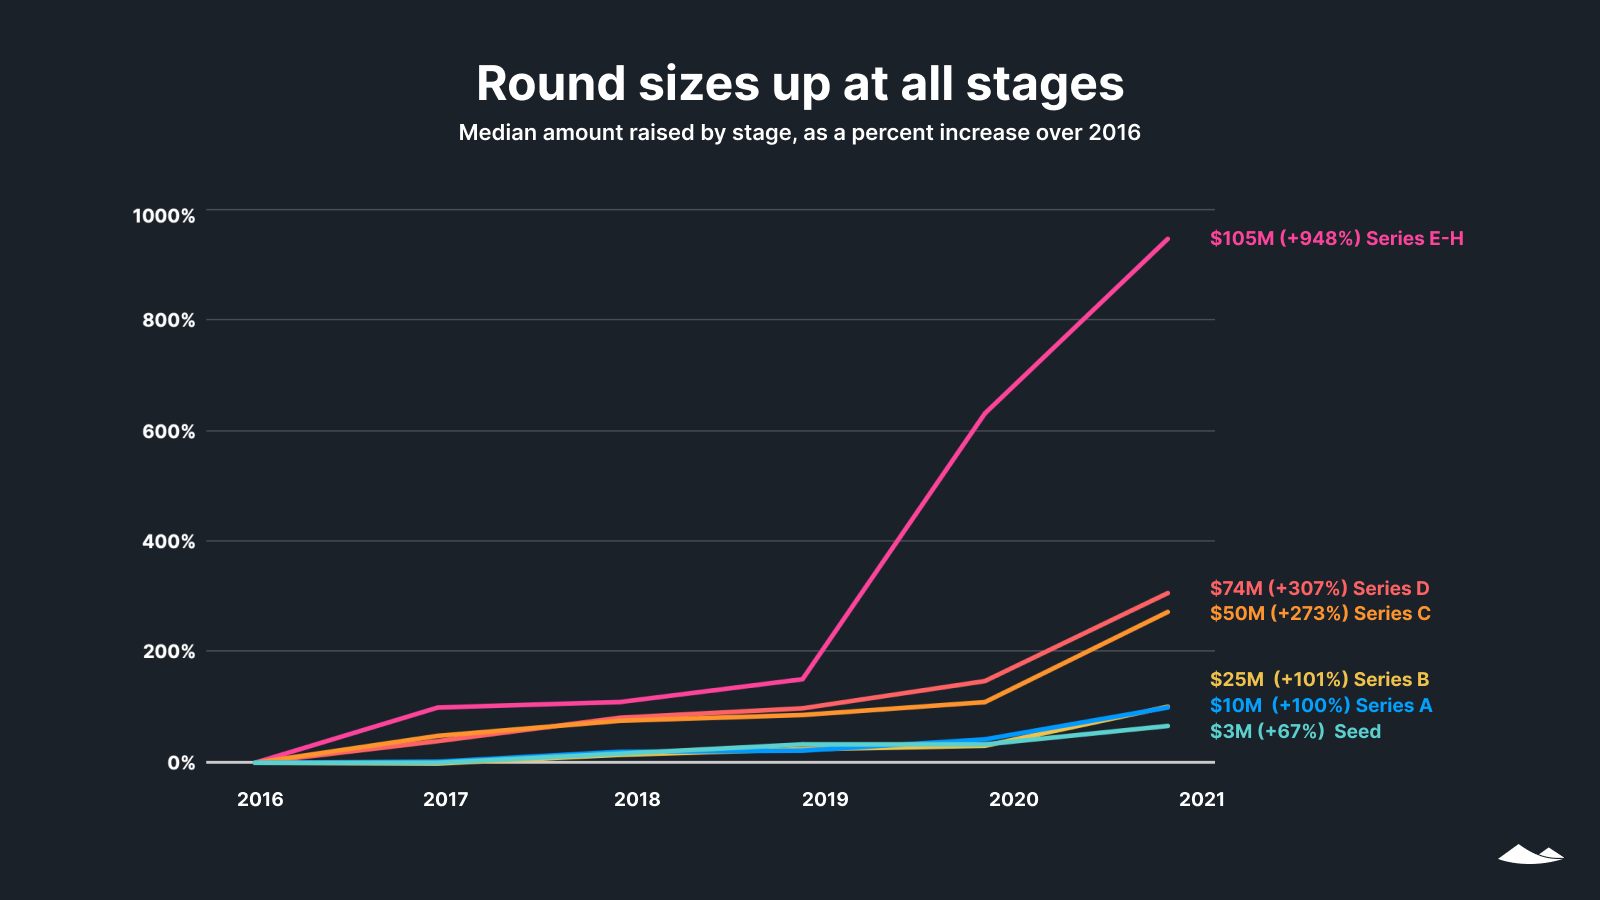
Median raise amounts increased in 2021, with a steep jump in the pace of growth at all stages except Series E-H, which saw a large increase in 2020. At nearly every stage, the median raise in dollars grew in 2021 by as much or more than in the four years from 2016 to 2020. (The only exception to the trend was in Series E-H rounds.)
Due to soaring valuations in 2021, increasing round sizes didn’t come at the cost of greater dilution of founders’ ownership.
Dilution
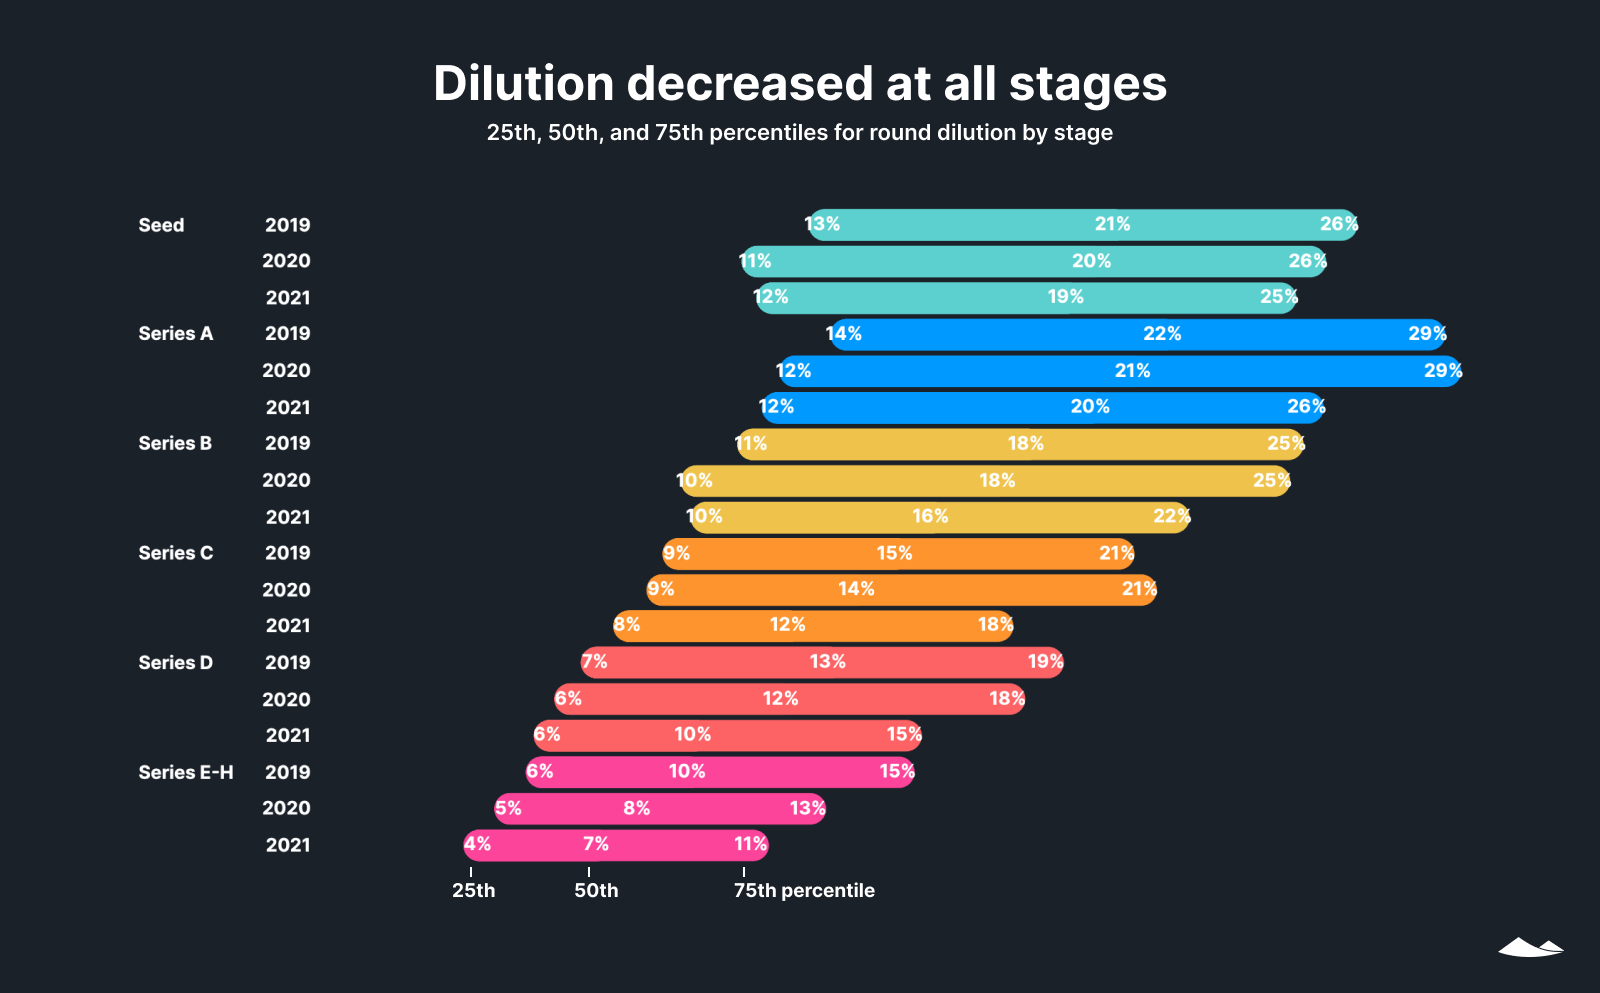
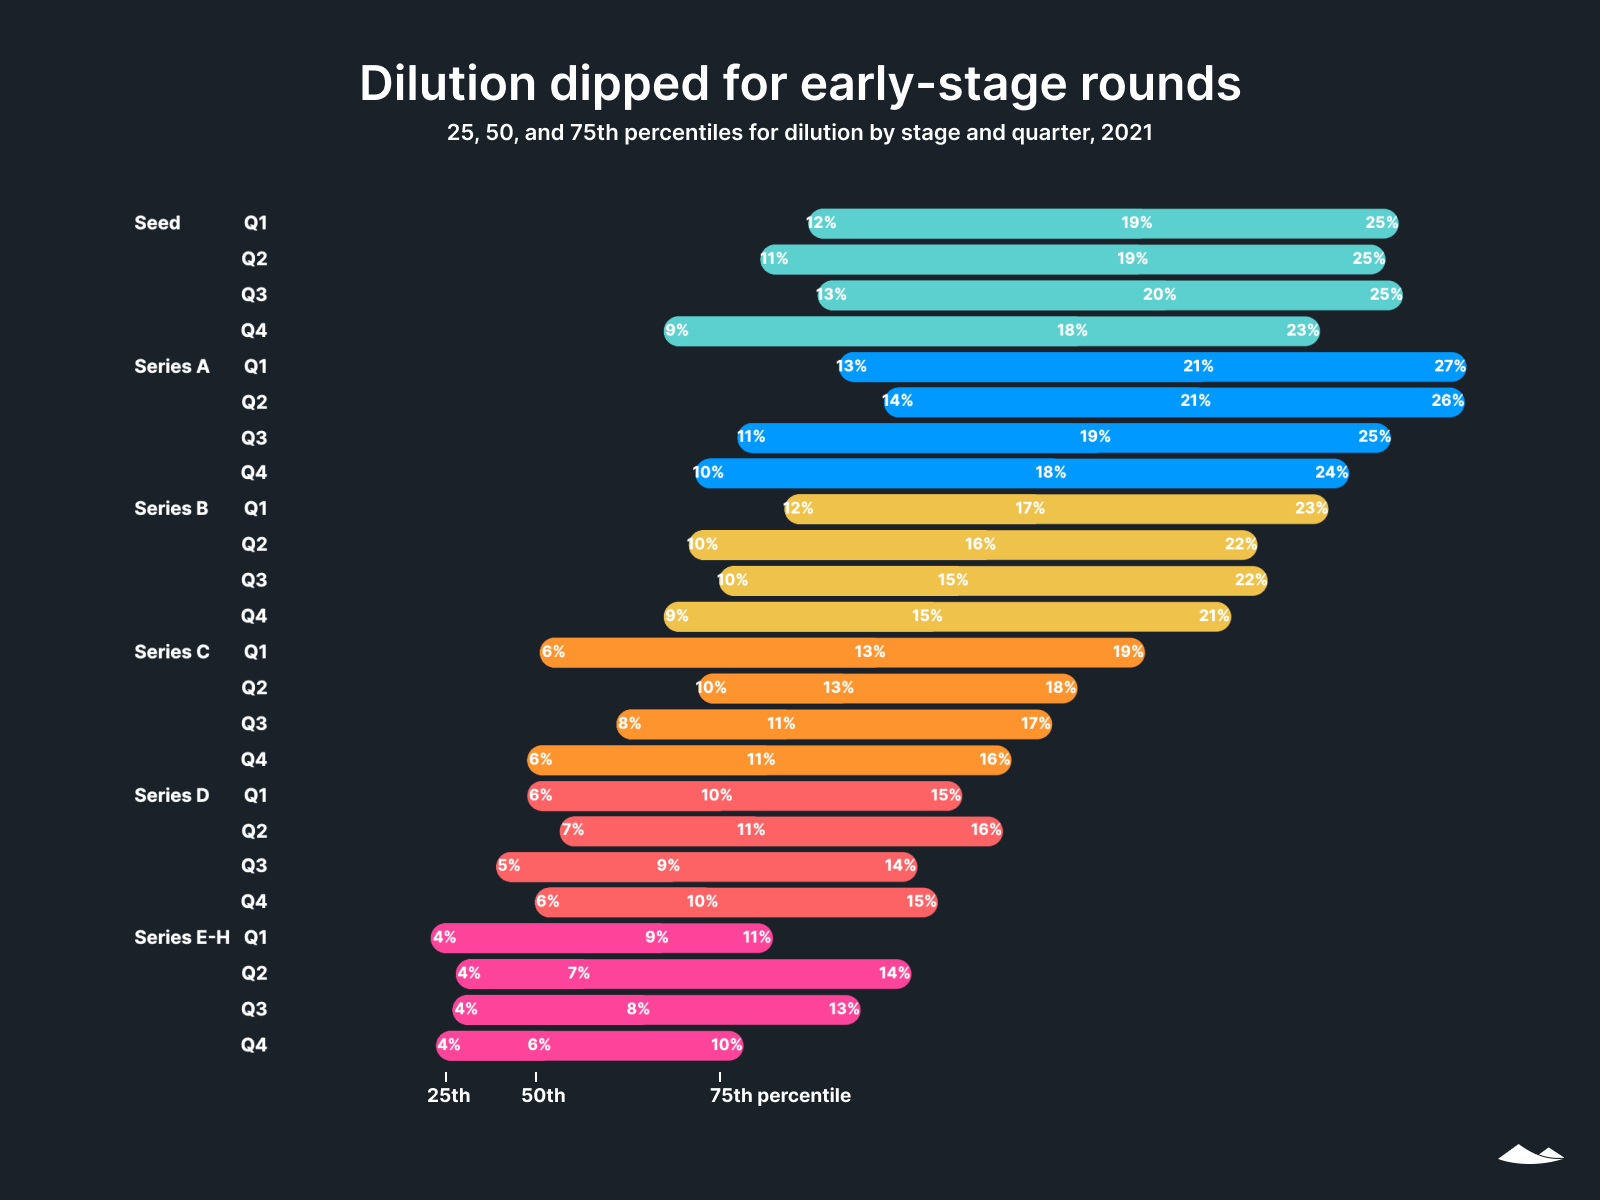
Dilution continued decreasing at all stages, as it has since 2019. The median founder gave up two to three percent less of their company in 2021 than they would have two years earlier at the same stage.
This steady decrease in dilutions is fairly recent. From 2016 to 2019, changes in dilutions were less consistent: Series A, B, and C saw small decreases in dilution, while the others saw small increases, for an average decrease of 0.25% across all stages over the three-year timespan.
The range of dilution also tightened over the past two years, for all but seed rounds. In 2021, the difference between the 25th and 75th percentiles for Series E-H companies was only seven percentage points. But we see this tightening even for earlier-stage companies, where uncertainty around valuation tends to be greater.
Early-stage headcounts
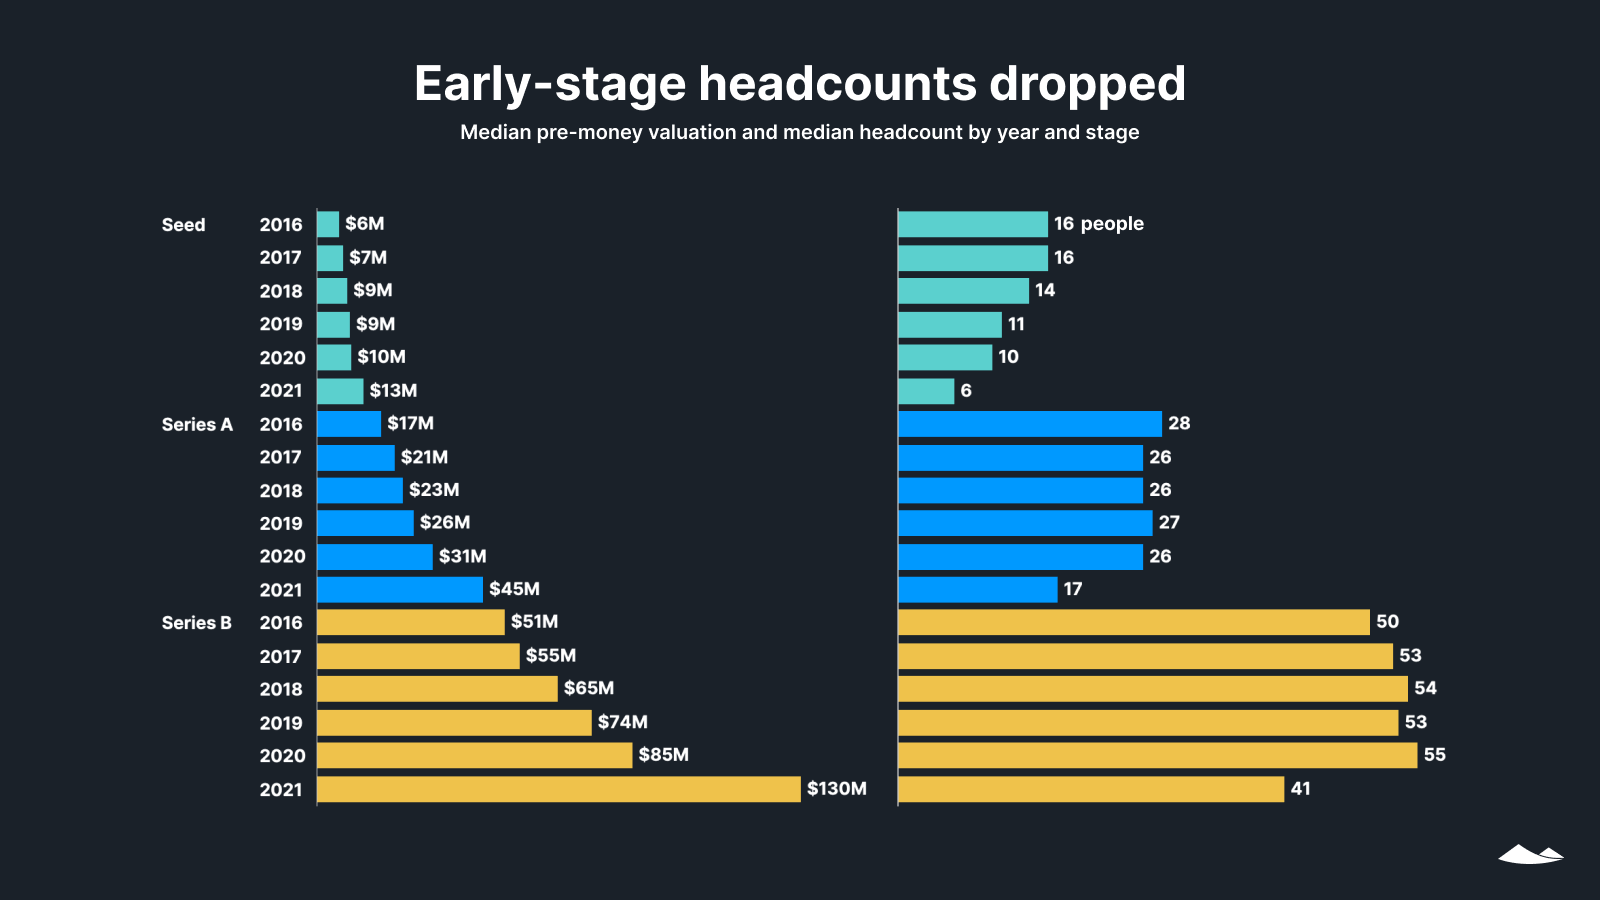
Median pre-money valuations from seed to Series B continued a growth trend in 2021, even while median headcounts for these companies have declined.
Headcount is unlikely to be a primary driver of any single company’s valuation. However, this market-wide shift, apparent in Carta’s data across industries, suggests that the market may be expecting more future value from each employee. This may reflect growth in infrastructure, technologies, and knowledge across the startup ecosystem that can allow it to produce value with smaller teams. It may also be that investment money flooding the market has driven up valuations across the board.
Late-stage headcounts
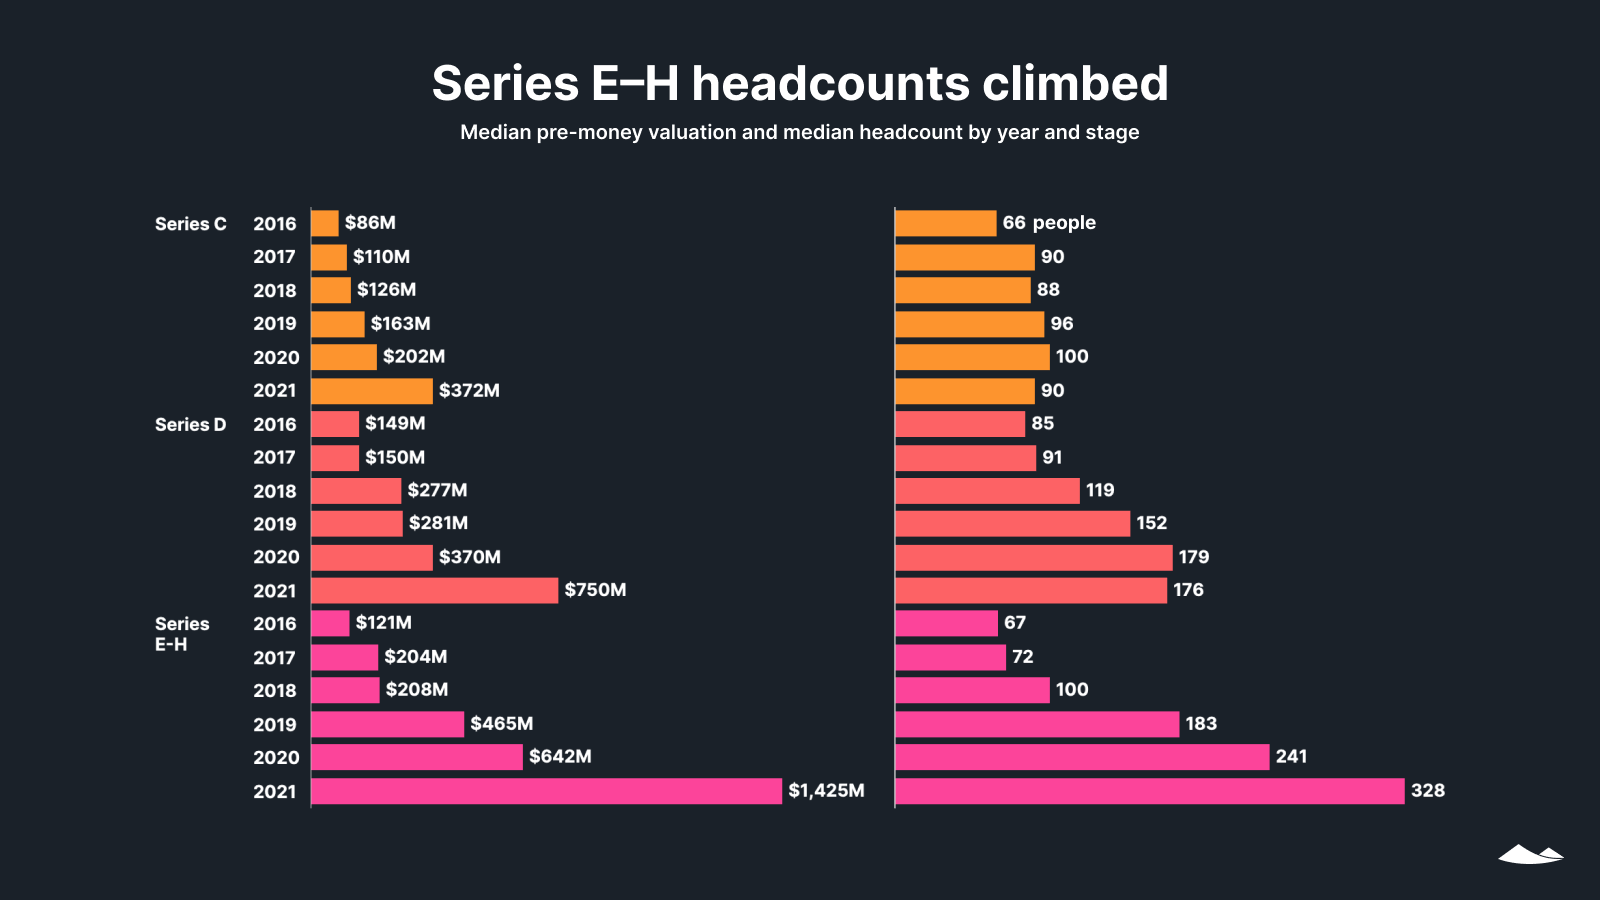
At Series E and above, both pre-money valuations and headcounts increased substantially over the past five years—a change which does not seem to be driven by any shifts in the mix of Series E, F, G, and H rounds within this category during any given year. In this group, median pre-money valuations have increased by 11x and headcounts by 4x since 2016.
The trends at Series C and D lie somewhere in between those of earlier and later stages, with moderate median headcount increases over four years followed by slight dips in 2021.
Employee departures
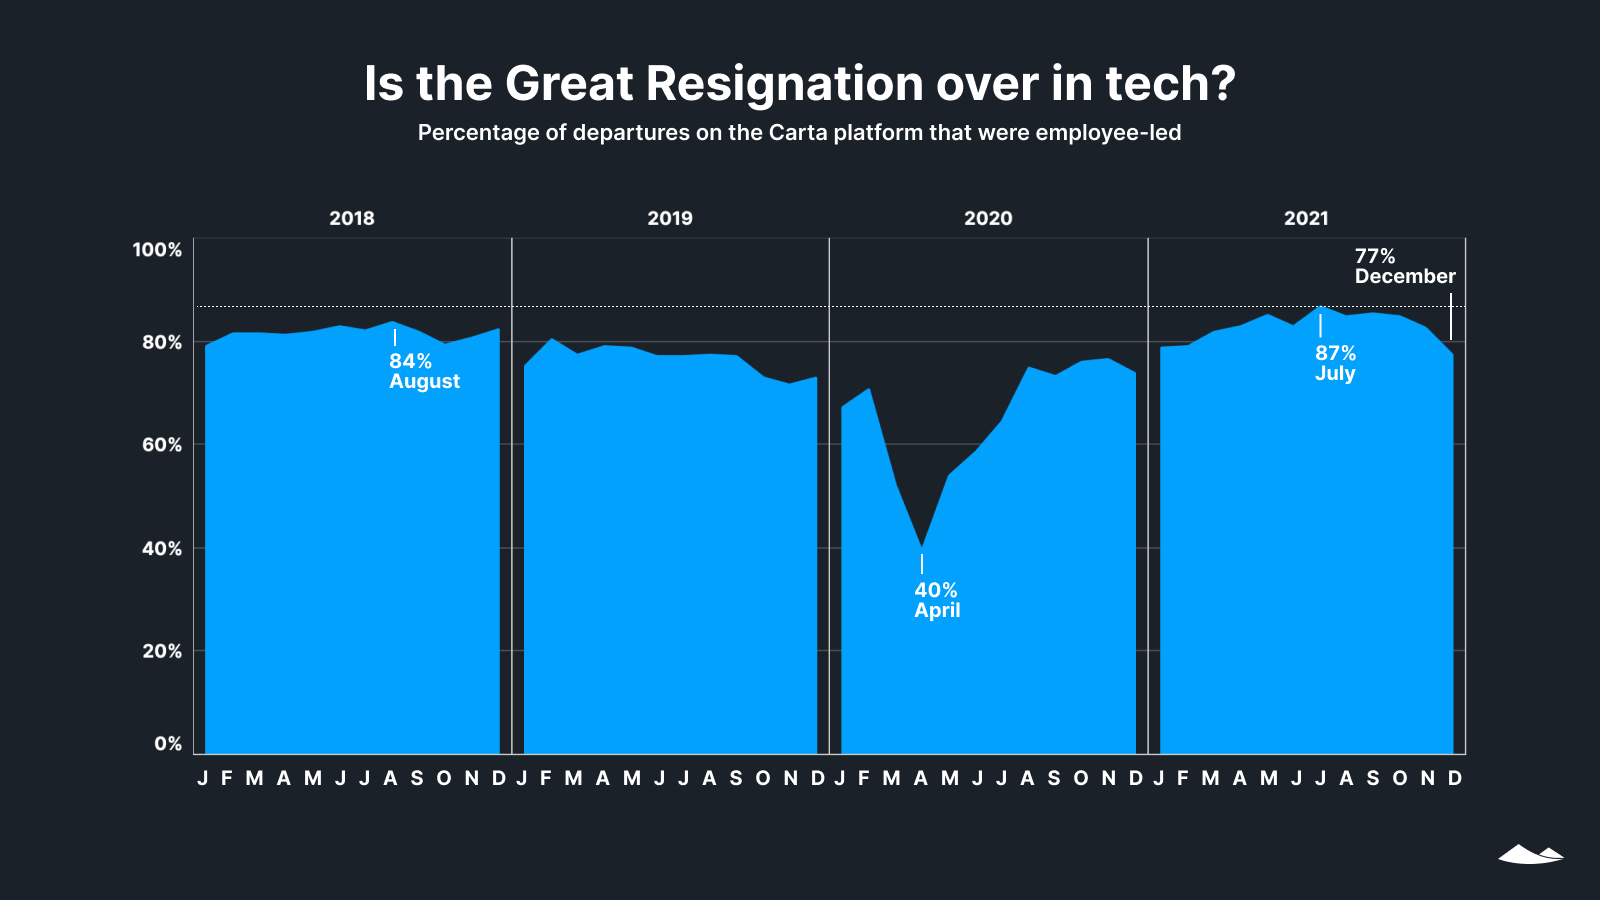
The percent of departures that were employee-led peaked at 87% in July 2021 and then began to drop. That number went down each month in Q4, dropping from 85% in October to 77% in December. These numbers suggest that the Great Resignation may be on the wane among companies on the Carta platform, which are heavily weighted toward tech startups.
For context, total departures on the Carta platform, whether initiated by the company or employee, were also on the decline in Q4 2021. These numbers are now back below levels seen in the first half of 2020. Involuntary departures peaked in April 2020, when pandemic-fueled economic shutdowns led to massive layoffs and labor market churn.
Employee options exercised
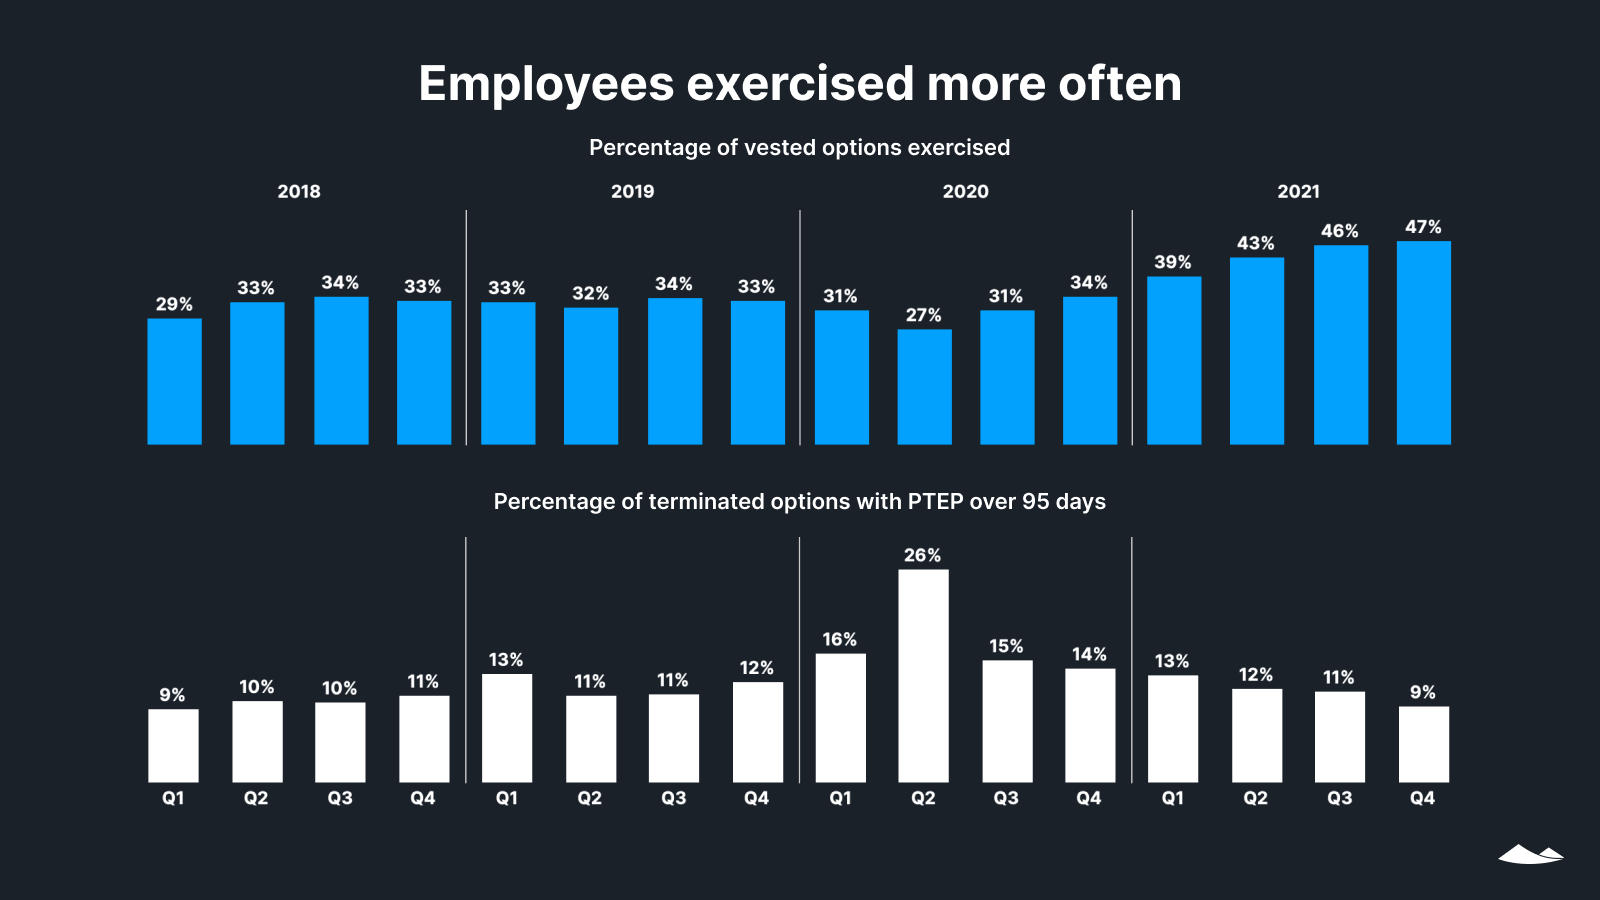
The percentage of vested options that were exercised by employees went up in each quarter in 2021. This may reflect employee confidence in their companies’ prospects for growth. It could also be that employees are taking advantage of new financing for stock exercise costs—or it might be a function of many households’ increased savings due to pandemic stimulus funds.
The percentage of companies offering a post-termination exercise period (PTEP) longer than 95 days continues to decline, after a peak in Q2 2020 during pandemic layoffs.
Tender offers
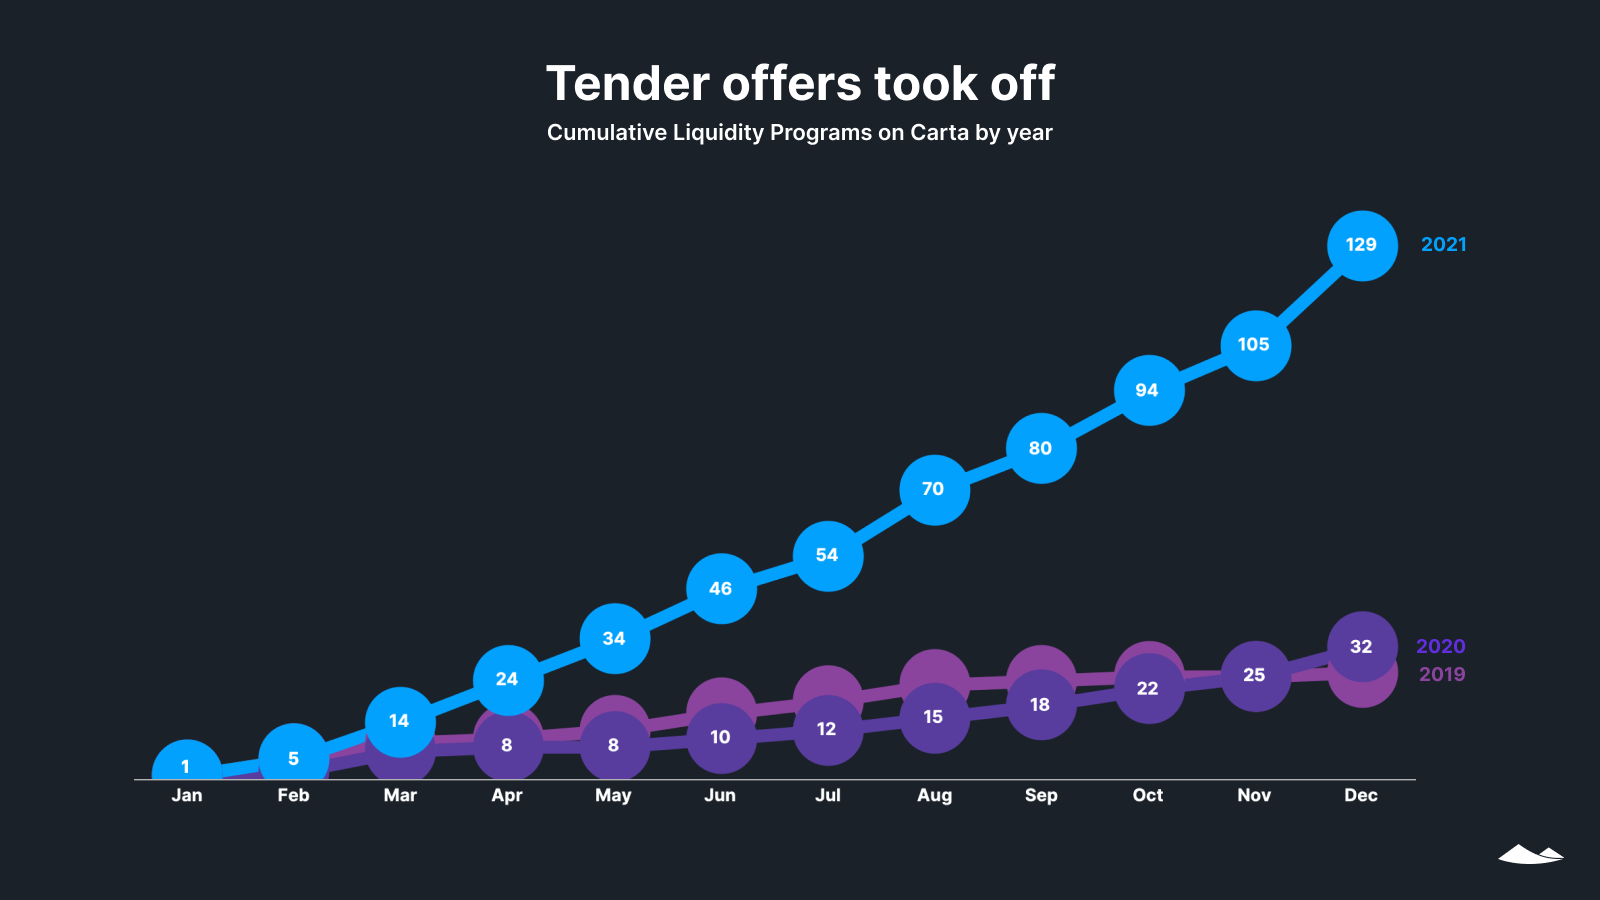
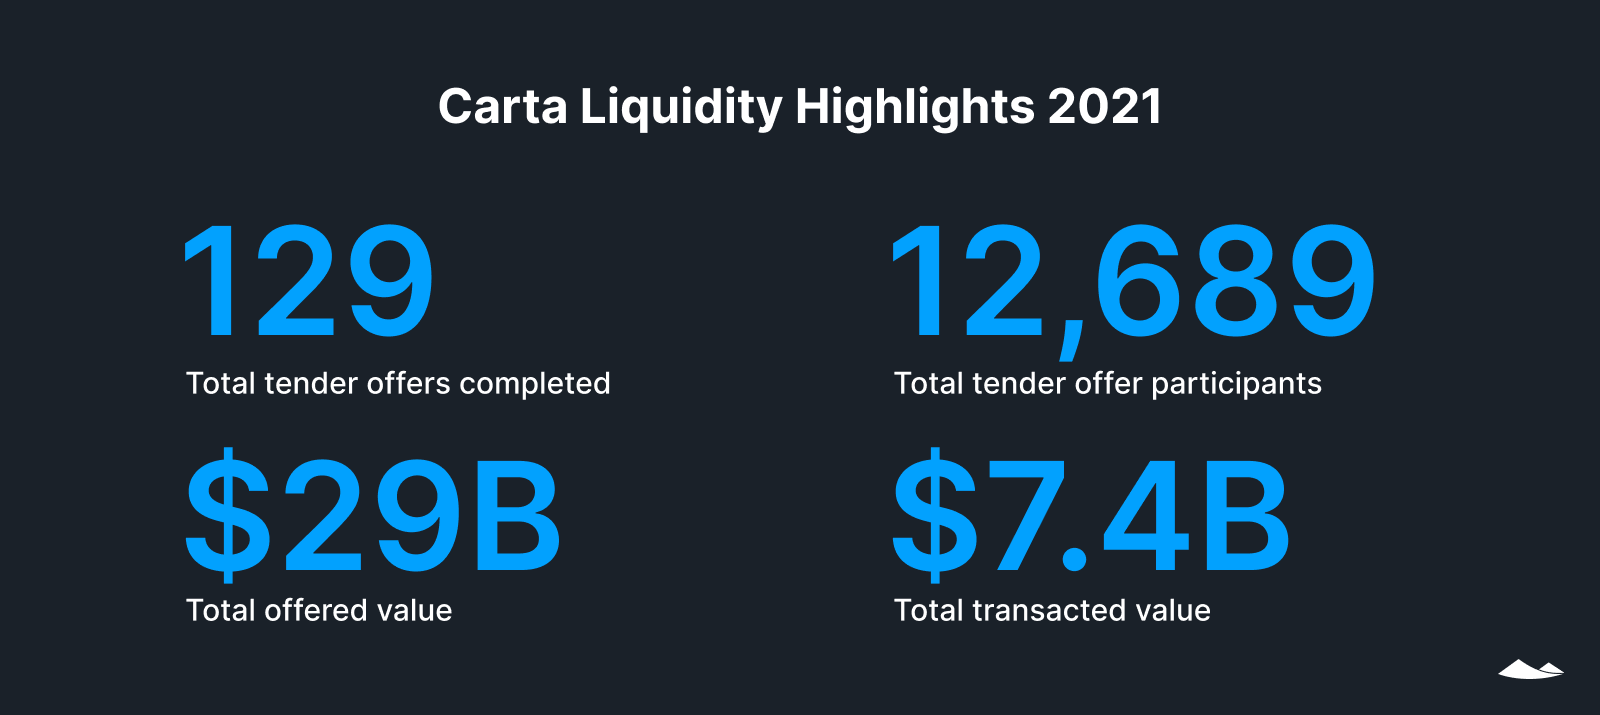
The past year saw four times as many tender offers on Carta versus the previous year, as more companies looked for ways to provide liquidity to employees and early investors without an IPO or merger. While most companies completing a tender offer have already raised a Series D round or above, companies at all stages are increasingly seeking liquidity.
Mergers and acquisitions
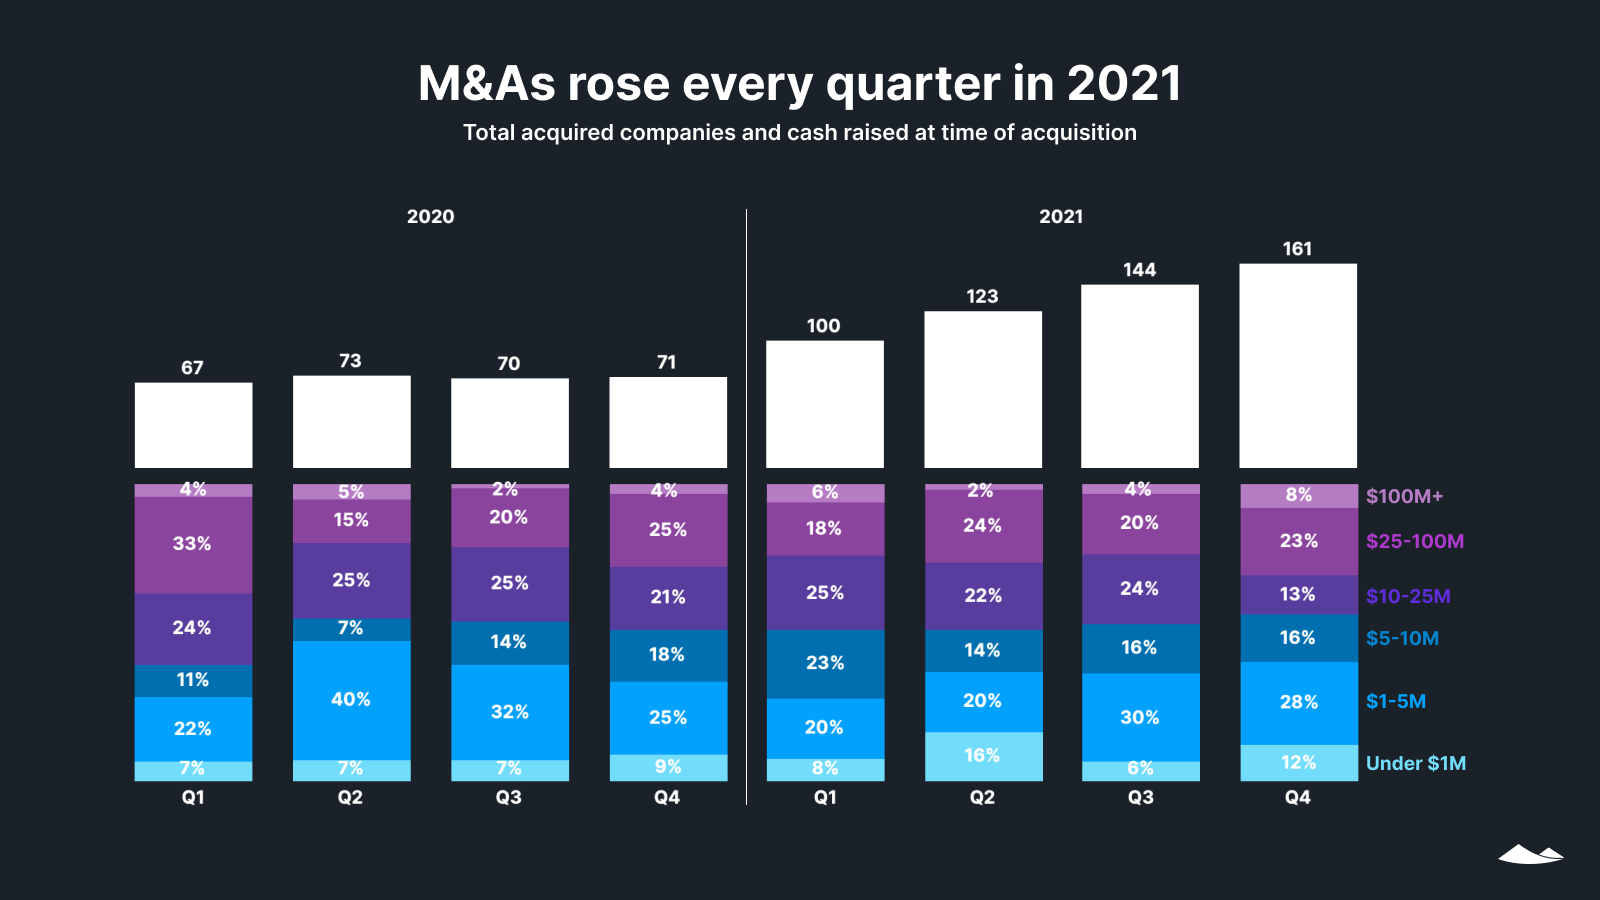
After remaining flat in 2020, merger and acquisition activity increased in every quarter in 2021, for an overall increase of 86% for 2021 over the prior year. In 2021, 53% of deals were for companies that had raised $10M or less, slightly up from 50% the previous year.
Q4 2021: A dip in venture activity
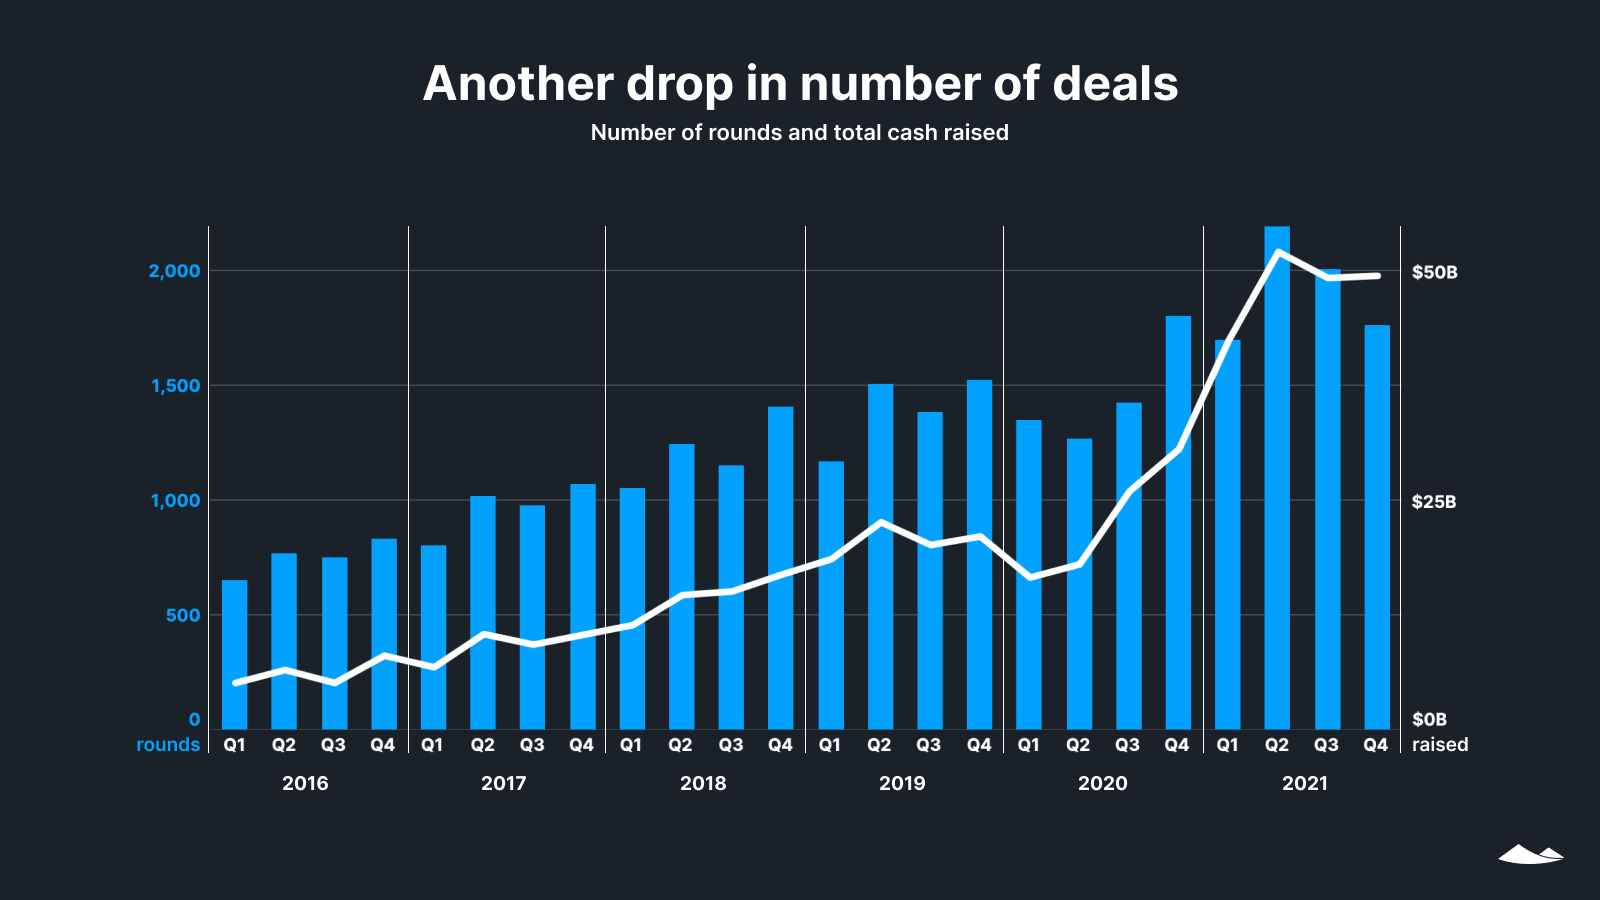
Rounds and cash raised by quarter
Within this record-setting year, venture funding peaked in Q2 and has since fallen for two successive quarters, with Q4 seeing 20% fewer deals and 5% less cash than Q2. The number of deals dropped by 8.5% in Q3, and by 12% in Q4. Total cash has fallen less precipitously, dipping by 5.5% in Q3 before stabilizing in Q4 with a slight 0.5% increase.
This said, Q4 still ended higher than any previous fourth quarter on total cash, and higher than any quarter other than Q4 2020 in terms of the number of deals. Valuations and raise amounts continued to rise in Q4, and we don’t know what 2022 will bring. We will watch these numbers carefully for signs of a sustained shift in the venture market.
Cash raised by stage
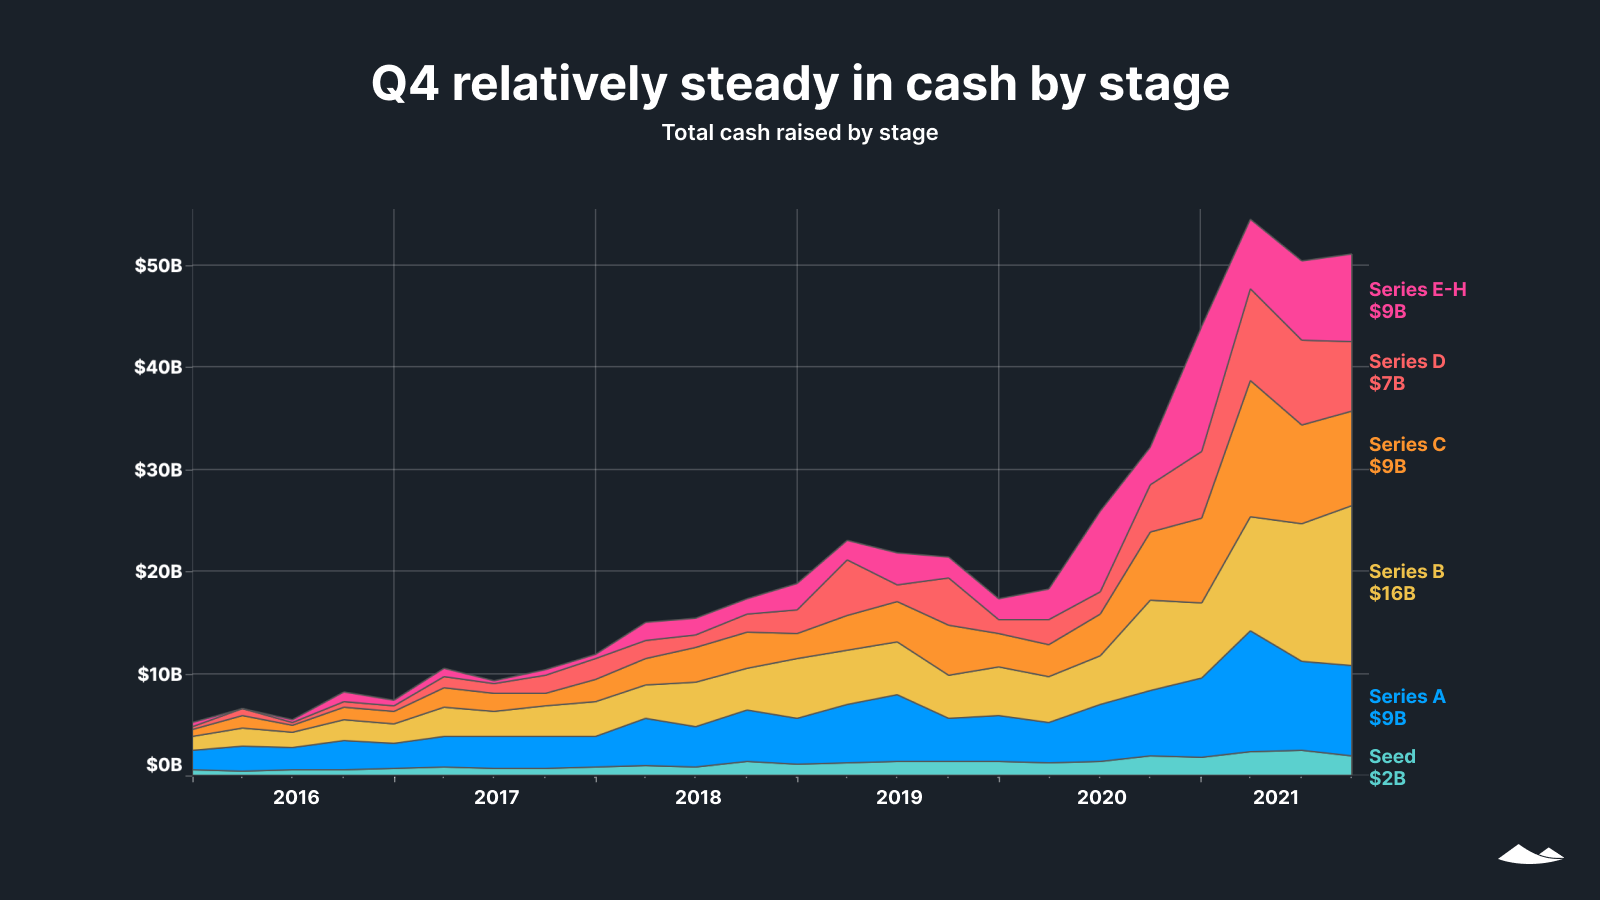
In absolute dollars, the amount of money raised by companies on the Carta platform has increased dramatically since the first half of 2020, when a decline in investments that began in Q3 2019 accelerated in the early weeks of the pandemic. From Q4 2019 to Q4 2021, the total volume of venture deals has increased by 139% to $51.1B.
This volume largely held steady from Q3 to Q4. The exception was the Series B stage, which saw a 16% jump to $15.7B. Much of this increase in Series B money was due to a small number of mega-deals.
SAFEs and convertible notes
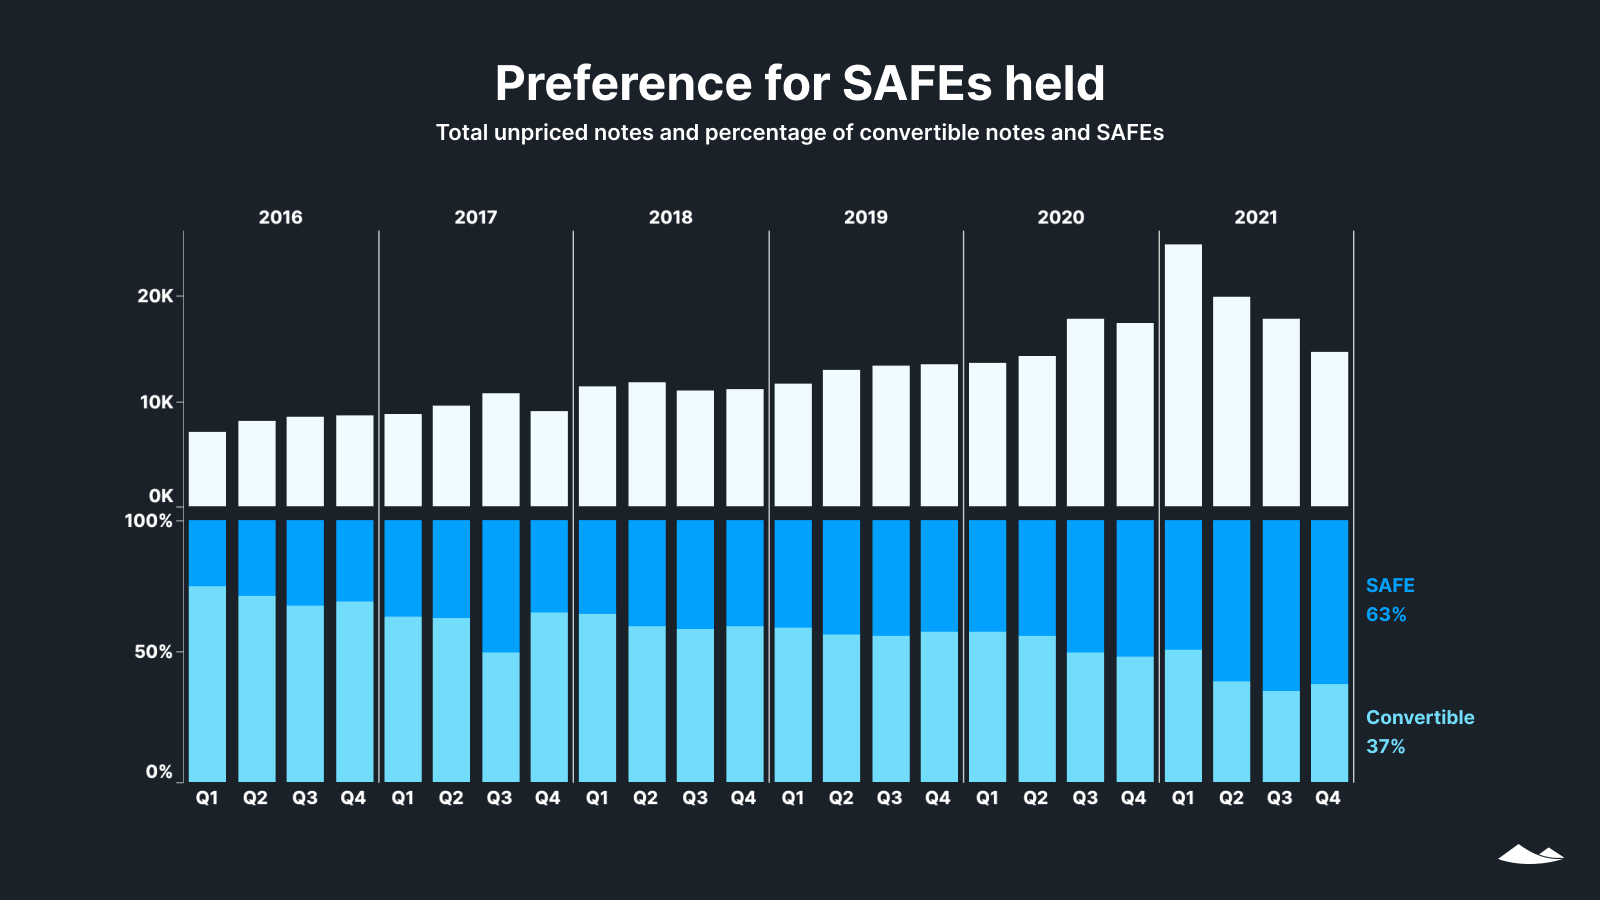
There were more SAFEs and convertible notes than ever in 2021, but since Q1 we have seen three quarters of declines. It’s possible that the flood of venture capital into seed and later-stage rounds has reduced founders’ reliance on these vehicles for early-stage unpriced rounds. The median size of both SAFEs and convertible notes in 2021 was $50,000, with SAFEs having a mean size of $238,000 and convertible notes having a mean size of $353,000. This is compared with a median seed round of $3M.
The move from convertible notes (which have fixed interest rates and maturity dates) toward SAFEs (which do not), has been a steady trend for years. While it is too soon to tell whether this shift has stabilized, 63% of unpriced notes on Carta in Q4 were SAFEs, allowing founders to quickly and flexibly access capital.
Early-stage round size distribution
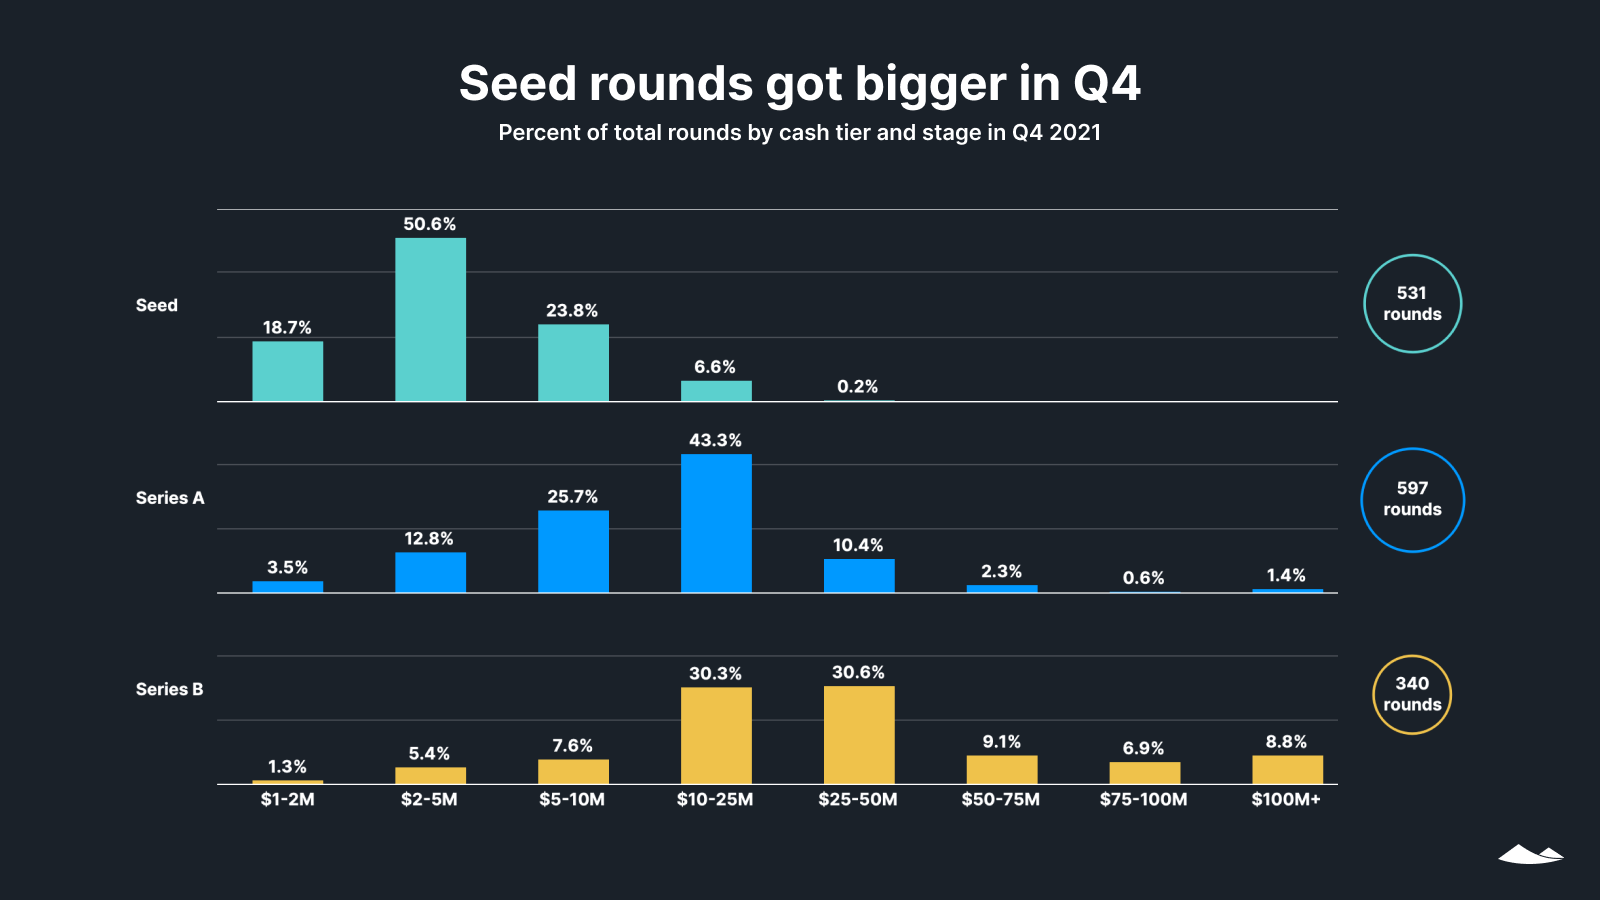
When the median amount raised by stage increases as quickly as it did in Q4, understanding the distribution of recent round sizes is critical for both founders and investors to benchmark their deals.
For example, the most common size of seed-stage deals in Q4 was between $2M and $5M, whereas just one quarter earlier, it was $1M to $2M. For Series A, 25% of deals were under $5M in Q3, whereas this represented only 16% of deals in Q4. For Series B, 21% of deals were under $10M in Q3, and by Q4 only 14% of deals were below this threshold.
Late-stage round size distribution
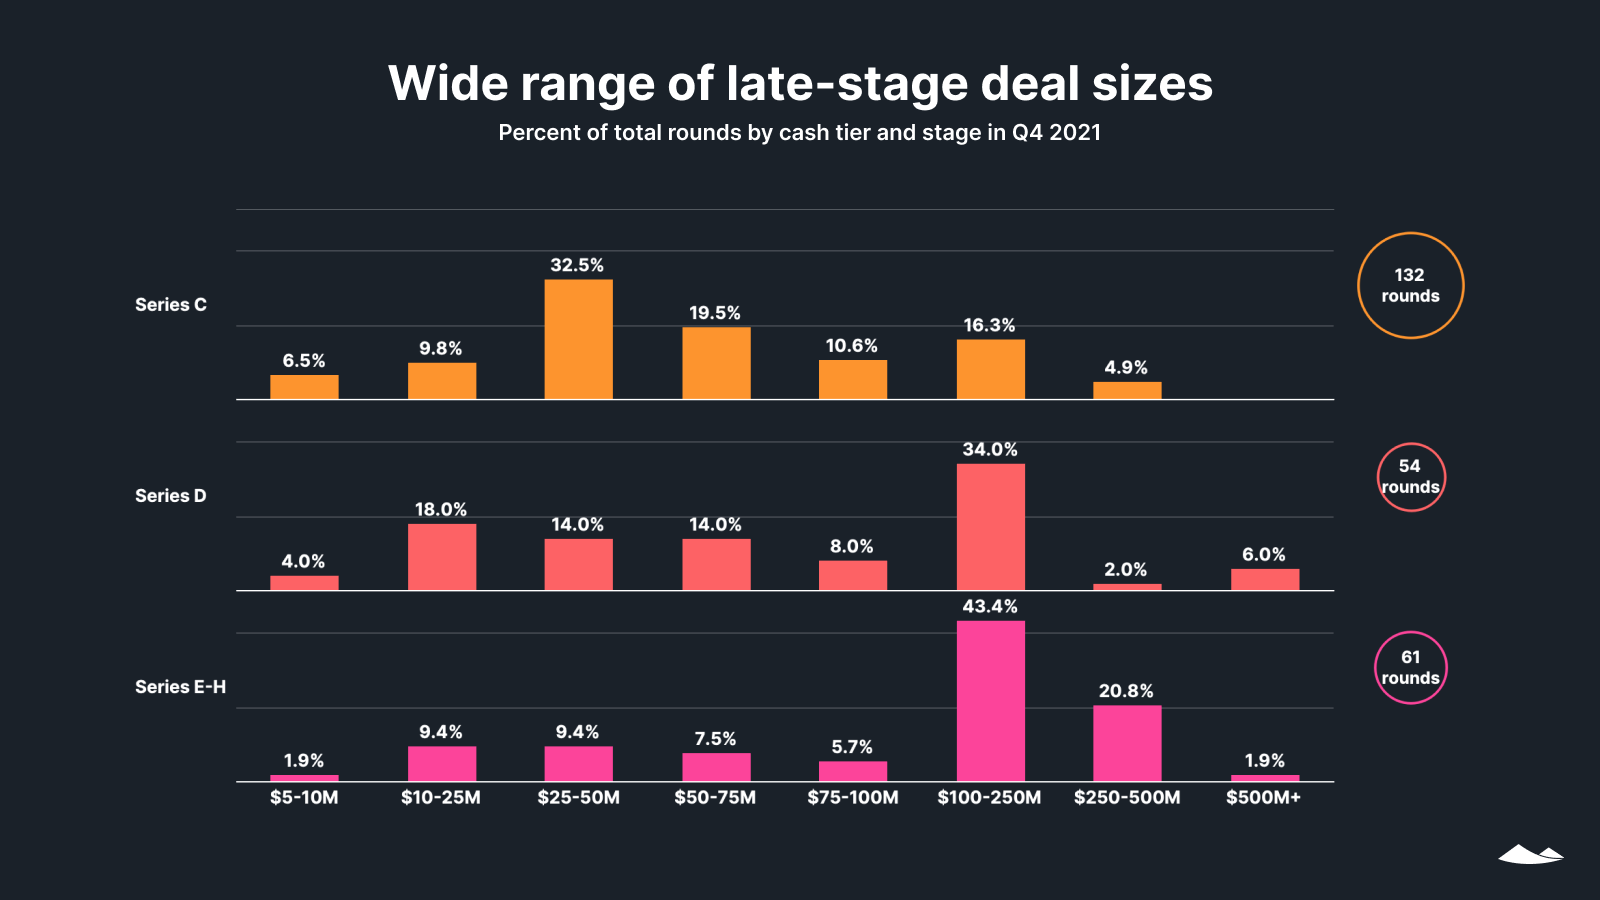
There continued to be a wide range of deal sizes in late stage rounds, as in previous quarters. The distribution of deal sizes didn’t change as much quarter over quarter for Series C and D, as compared with early-stage rounds. Among companies fundraising at Series E and above, 66% of deals were above $100M in Q4, versus 56% the previous quarter.
Early-stage valuations and raises
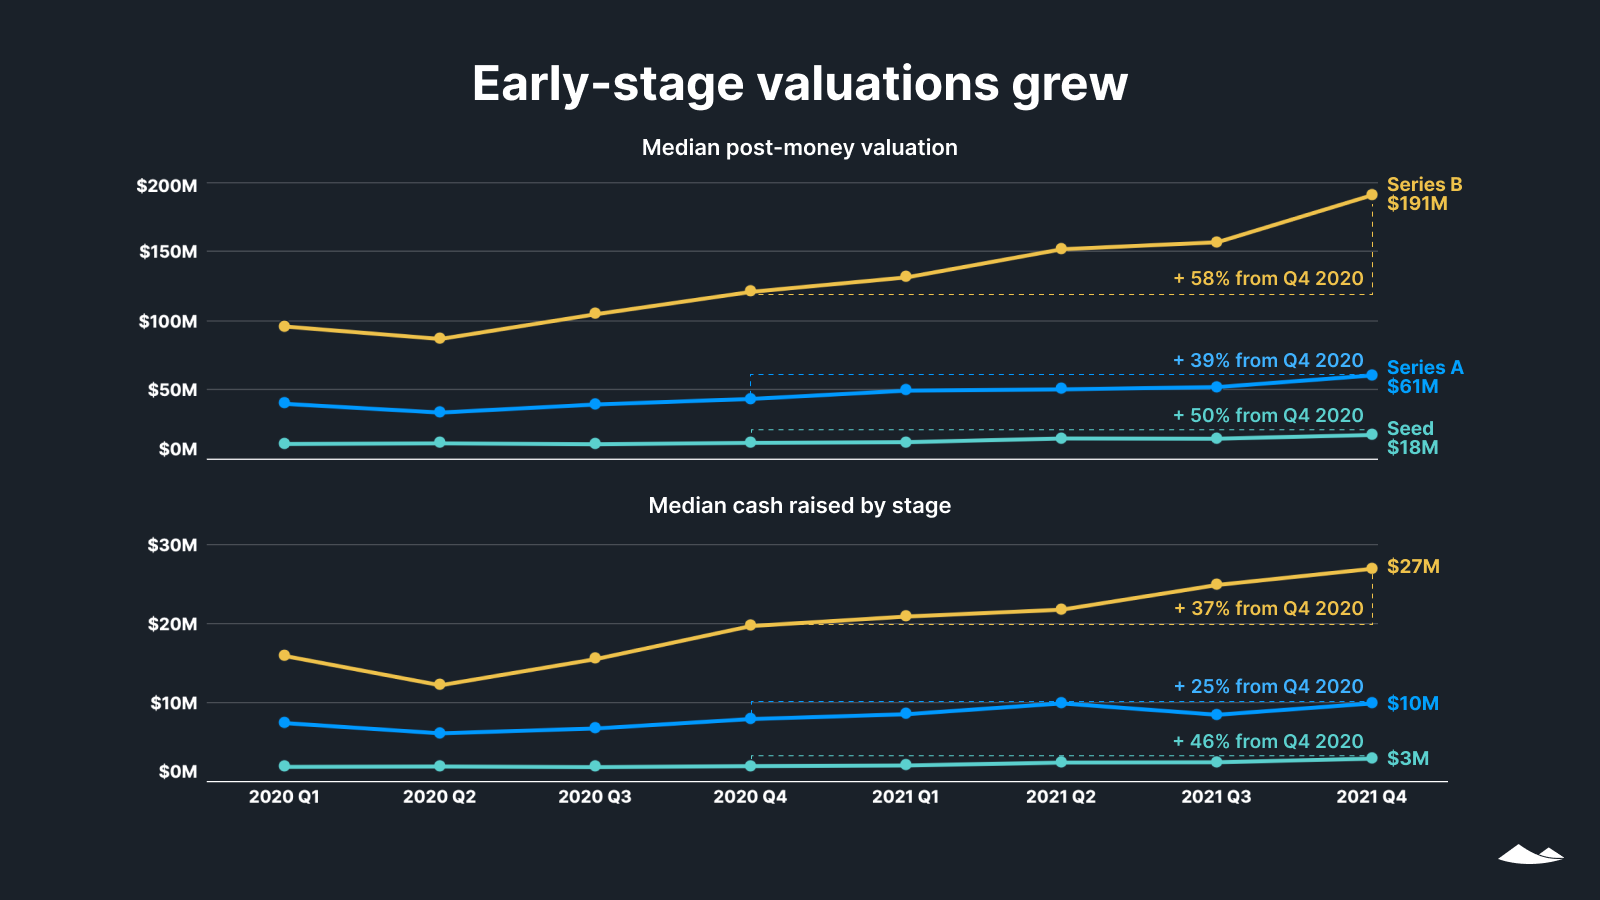
Median post-money valuations and median raise sizes continued to rise for all early stages, both in Q4 over Q3 and year over year. Series B valuations rose steeply, with a 58% increase year over year for Q4.
Late-stage valuations and raises
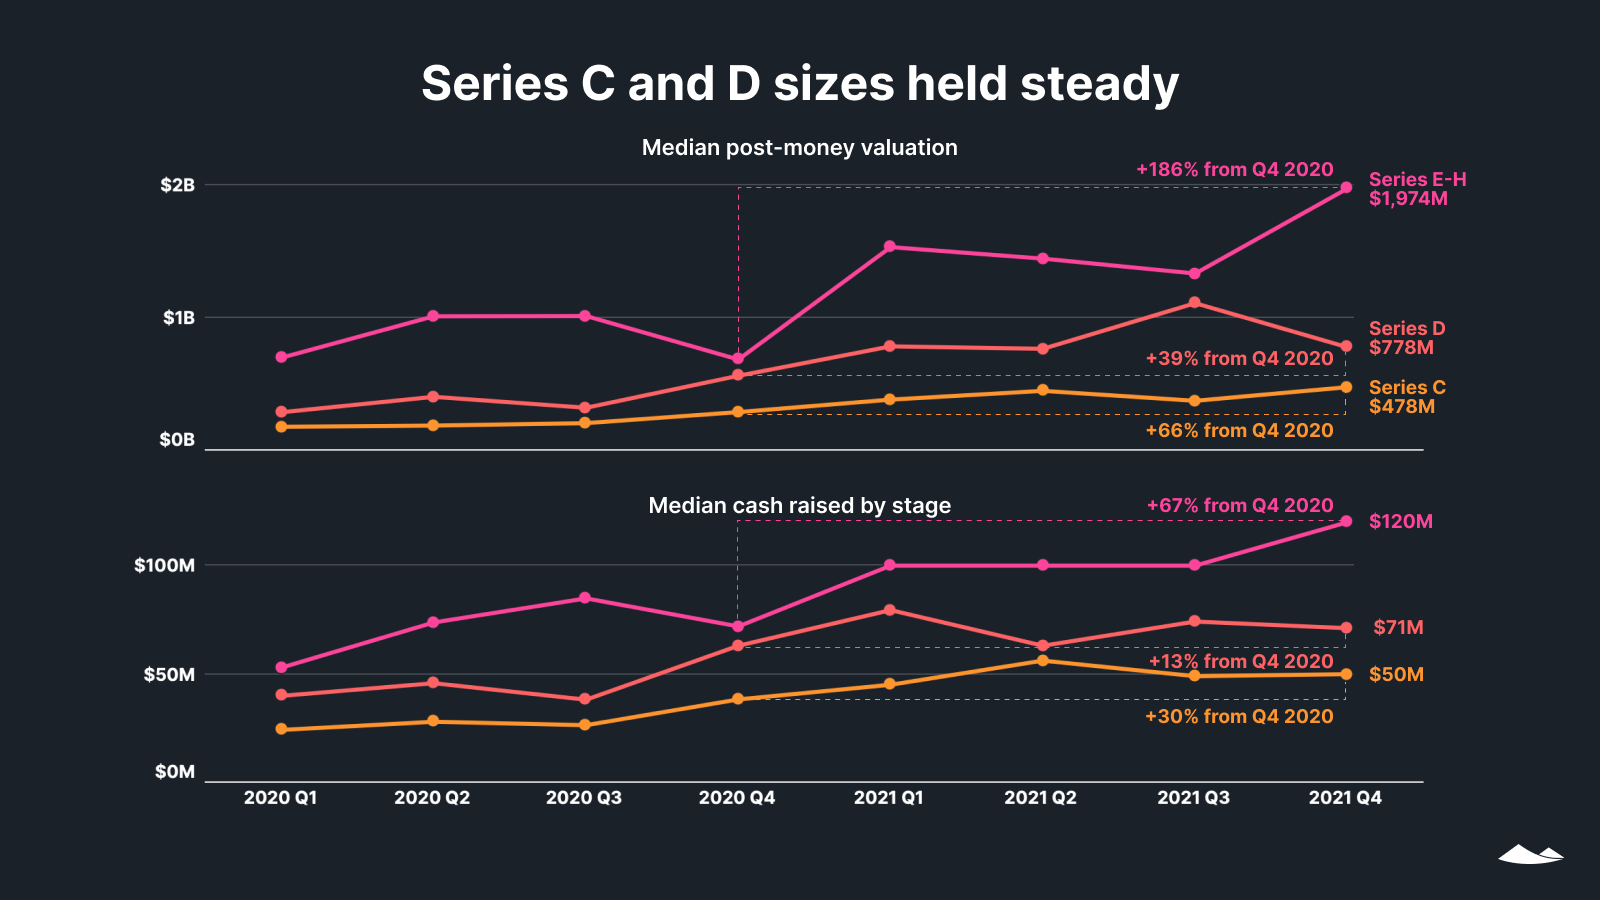
While the median amounts raised at Series E and above increased in Q4, round sizes for Series C and D held steadier from the previous quarter.
For companies that closed a Series C round in Q4, 21% were unicorns based on their post-money valuation. At Series D, 35% of companies were unicorns, and at Series E and above it was 69%.
Dilution by quarter
At every stage but Series D, the median amount of dilution was lower in Q4 than in any other quarter in 2021. Dilution was down in 2021 relative to previous years for all stages, but the trends have been somewhat uneven within the year. We will continue to watch whether dilutions continue to creep down in 2022.
Download a PDF of this State of private markets: Q4 2021 and year in review report.
Methodology
Carta’s State of Private Markets report examines trends across venture-backed companies and security holders in private companies to promote transparency between employers and employees, prompting fair equity management across private markets. Carta uses its quarterly data, including the aggregated and anonymized data of more than 26,000 companies—which represents over $2 trillion in post-money valuation and reflects more than 250,000 investors in the startup ecosystem.
Overview
Carta helps more than 26,000 primarily venture-backed companies and 1,600,000 security holders manage equity. This study uses an aggregated and anonymized sample of Carta’s data. Companies that have contractually requested that we not use their data in anonymized and aggregated studies are not included in this analysis.
The data presented in this private markets report represents a snapshot as of January 31, 2021. Historical data may change in future studies because there is typically an administrative lag between the time a transaction took place and when it is recorded in Carta. In addition, new companies signing up for Carta’s services will increase historical data available for the report.
Financings
Financings include equity deals raised in USD. The financing “series” (e.g. Series A) is taken from the legal share class name. Financing rounds that don’t follow this standard are not included in any data shown by series but are included in data not shown by series. Primary rounds are defined as the first equity round within a series. Bridge rounds are defined as any round raised after the first round in a given series. If there is no indication that a round is a Primary or Bridge round, both are included.
In some cases, convertible notes are raised and converted into multiple share classes within a series at various discounted prices (e.g. Series A-1, Series A-2, Series A-3). In these cases, converted securities are not included in cash raised, and only the post-money valuation of the new money is included.
Industry groupings
We grouped industries as follows: “SaaS” includes CRM software, edtech, and HR software in addition to other software as a service companies; “health + biotech” also includes healthcare devices and healthcare tech; “consumer” includes consumer products and services, such as food, cannabis, and video games; “hardware + logistics” also includes renewable energy, semiconductors, telecom, and transportation; “fintech” includes financial exchanges; “data + security” includes cloud distribution, analytics, and cybersecurity; and “adtech + marketplace” also includes ecommerce and social media.
Terminations
Terminations entered into Carta must include a reason. Involuntary terminations include both terminations for performance and company layoffs. Voluntary terminations are employees who decided to leave of their own accord. Other termination reasons, including For Cause, Death, Disability, and Retirement were not included in the data and make up less than 1% of all terminations combined.