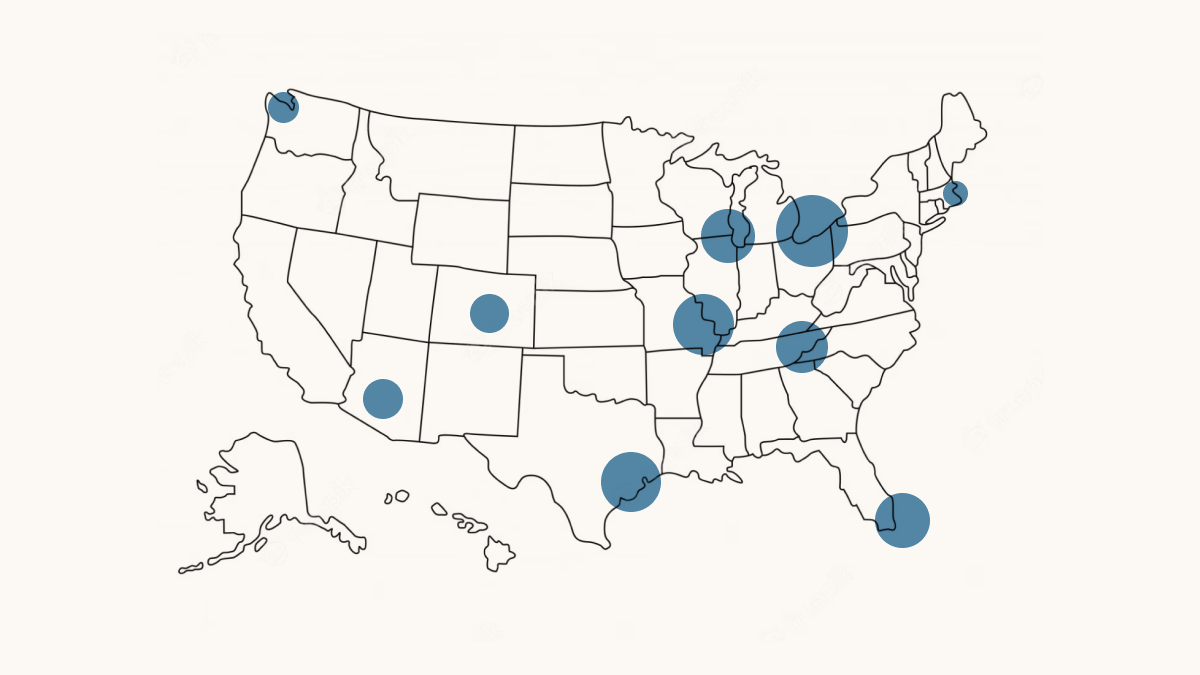
The map of venture capital funding in the U.S. is growing more diverse every year. You can of course still find robust startup ecosystems in major coastal hubs like the Bay Area, New York, Boston, and Seattle. But in 2023, you can also find them in places like Nashville, Houston, Pittsburgh, and Indianapolis.
The geographic diversification of the venture economy is a welcome development for startups in emerging ecosystems. Yet operating in a smaller market still poses certain challenges. One of these is battling the big-city competition for talent: Startups in established coastal hubs are historically much closer to dense populations of tech workers. Just as importantly, they’ve historically paid those workers higher salaries.
But in several smaller startup markets across the U.S., the salary playing field has started to level.
Carta’s survey of the state of startup compensation in the first half of 2023 found that benchmark compensation levels have ticked up significantly in many emerging VC markets, such as Raleigh, Las Vegas and Pittsburgh. Conversely, many large, established startup markets like Boston, Seattle, and Los Angeles have seen compensation levels hold steady or decline. The longstanding pay gap between mature and emerging venture ecosystems seems to be tightening.
The Salary-Cost Index (SCI)
How big are these differences in startup compensation between metro areas? And how closely do differences in compensation align with city-by-city data on cost of living?
To answer these questions, we created the Salary-Cost Index (SCI), a metric that compares Carta’s latest compensation benchmarks against government data on income, rent, and other key measures of cost of living. Each metro area receives an SCI score that measures the gap between median startup compensation and cost of living.
How to read the data
Because San Francisco has the highest compensation of any region, it has an SCI score of zero and serves as the statistical baseline. (By this metric, every city is still more affordable than San Francisco.)
A low SCI score means that compensation is closely aligned with cost of living. A high score means there’s a significant gap. In other words, workers in metros with high SCI scores have an opportunity to get more bang for their venture-backed buck.
We completed this exercise for the first time in March, using compensation data from the end of 2022. But things have changed. The job market has tightened: Companies in the U.S. added 336,000 new jobs in September, nearly doubling economists’ expectations. And Carta’s latest report on the state of startup compensation shows that, in many major U.S. metro areas, median startup compensation as compared to San Francisco is trending up. This has caused some notable shifts in SCI scores across the country.
Which metros are getting more affordable?
If a metro’s SCI score increases, that means it’s growing more affordable for startup workers—the gap between benchmark compensation and cost of living has gotten larger.
We compiled compensation and cost of living data to assign SCI scores to 50 of the largest metros in the U.S. The following chart shows the metros that experienced the largest gains in affordability for startup workers between the end of 2022 and H1 2023:
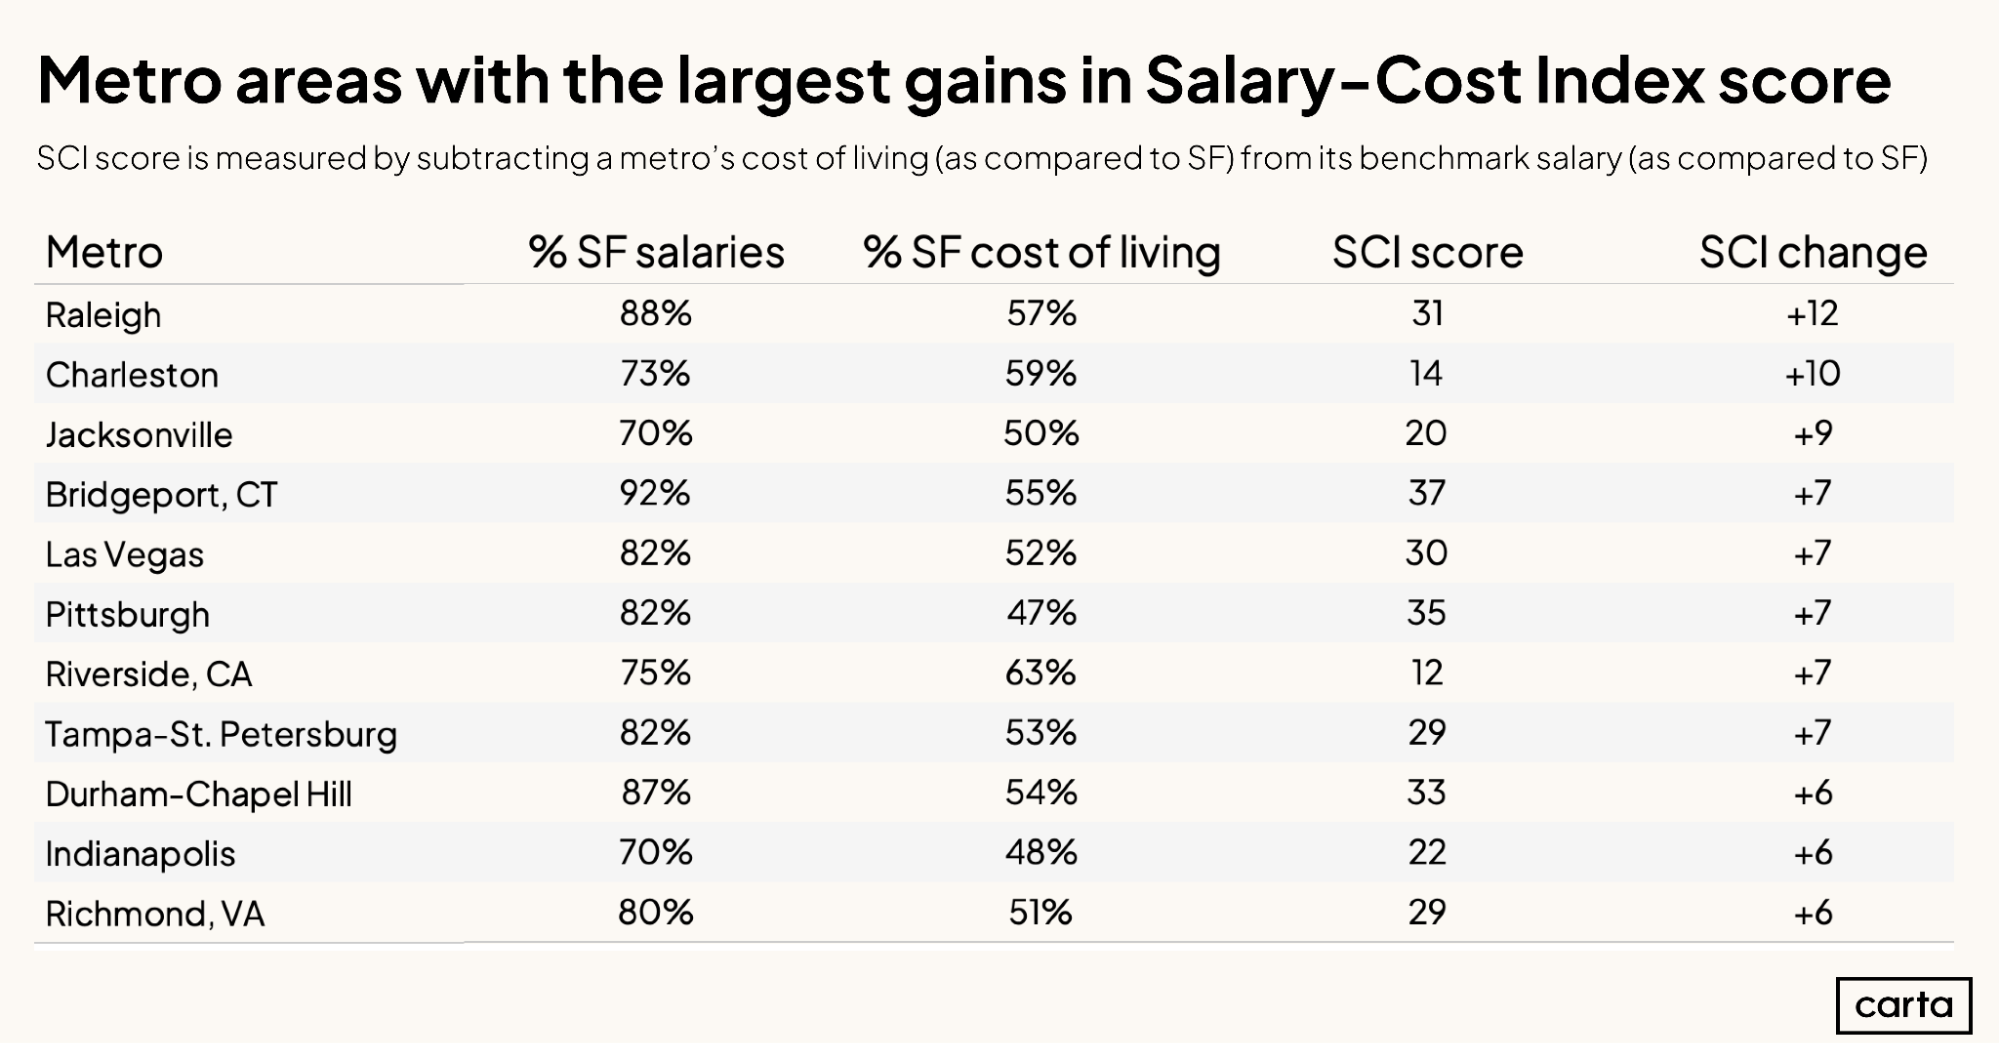
Six of these metro areas are located in the South census region, including each of the top three. Whether it’s worker compensation or the amount of seed funding being raised, the South’s ongoing rise in the venture landscape remains a storyline worth tracking.
Raleigh has an SCI score of 31, which ranks in the 68th percentile of this sample of 50 metros (i.e., it’s more affordable for startup workers than two-thirds of the competition). Charleston’s SCI score of 14, meanwhile, is in just the 9th percentile. Other SCI scores in this list range from 12 all the way to 37. There seems to be little correlation between a metro’s latest SCI score and the likelihood that score will increase significantly in the near future.
Which metros are getting less affordable?
If a region’s SCI score has decreased, that means it’s growing less affordable—the gap between compensation and cost of living has tightened. Here are all the metro areas in our sample that saw their SCI scores decline from the end of 2022 through H1 2023:
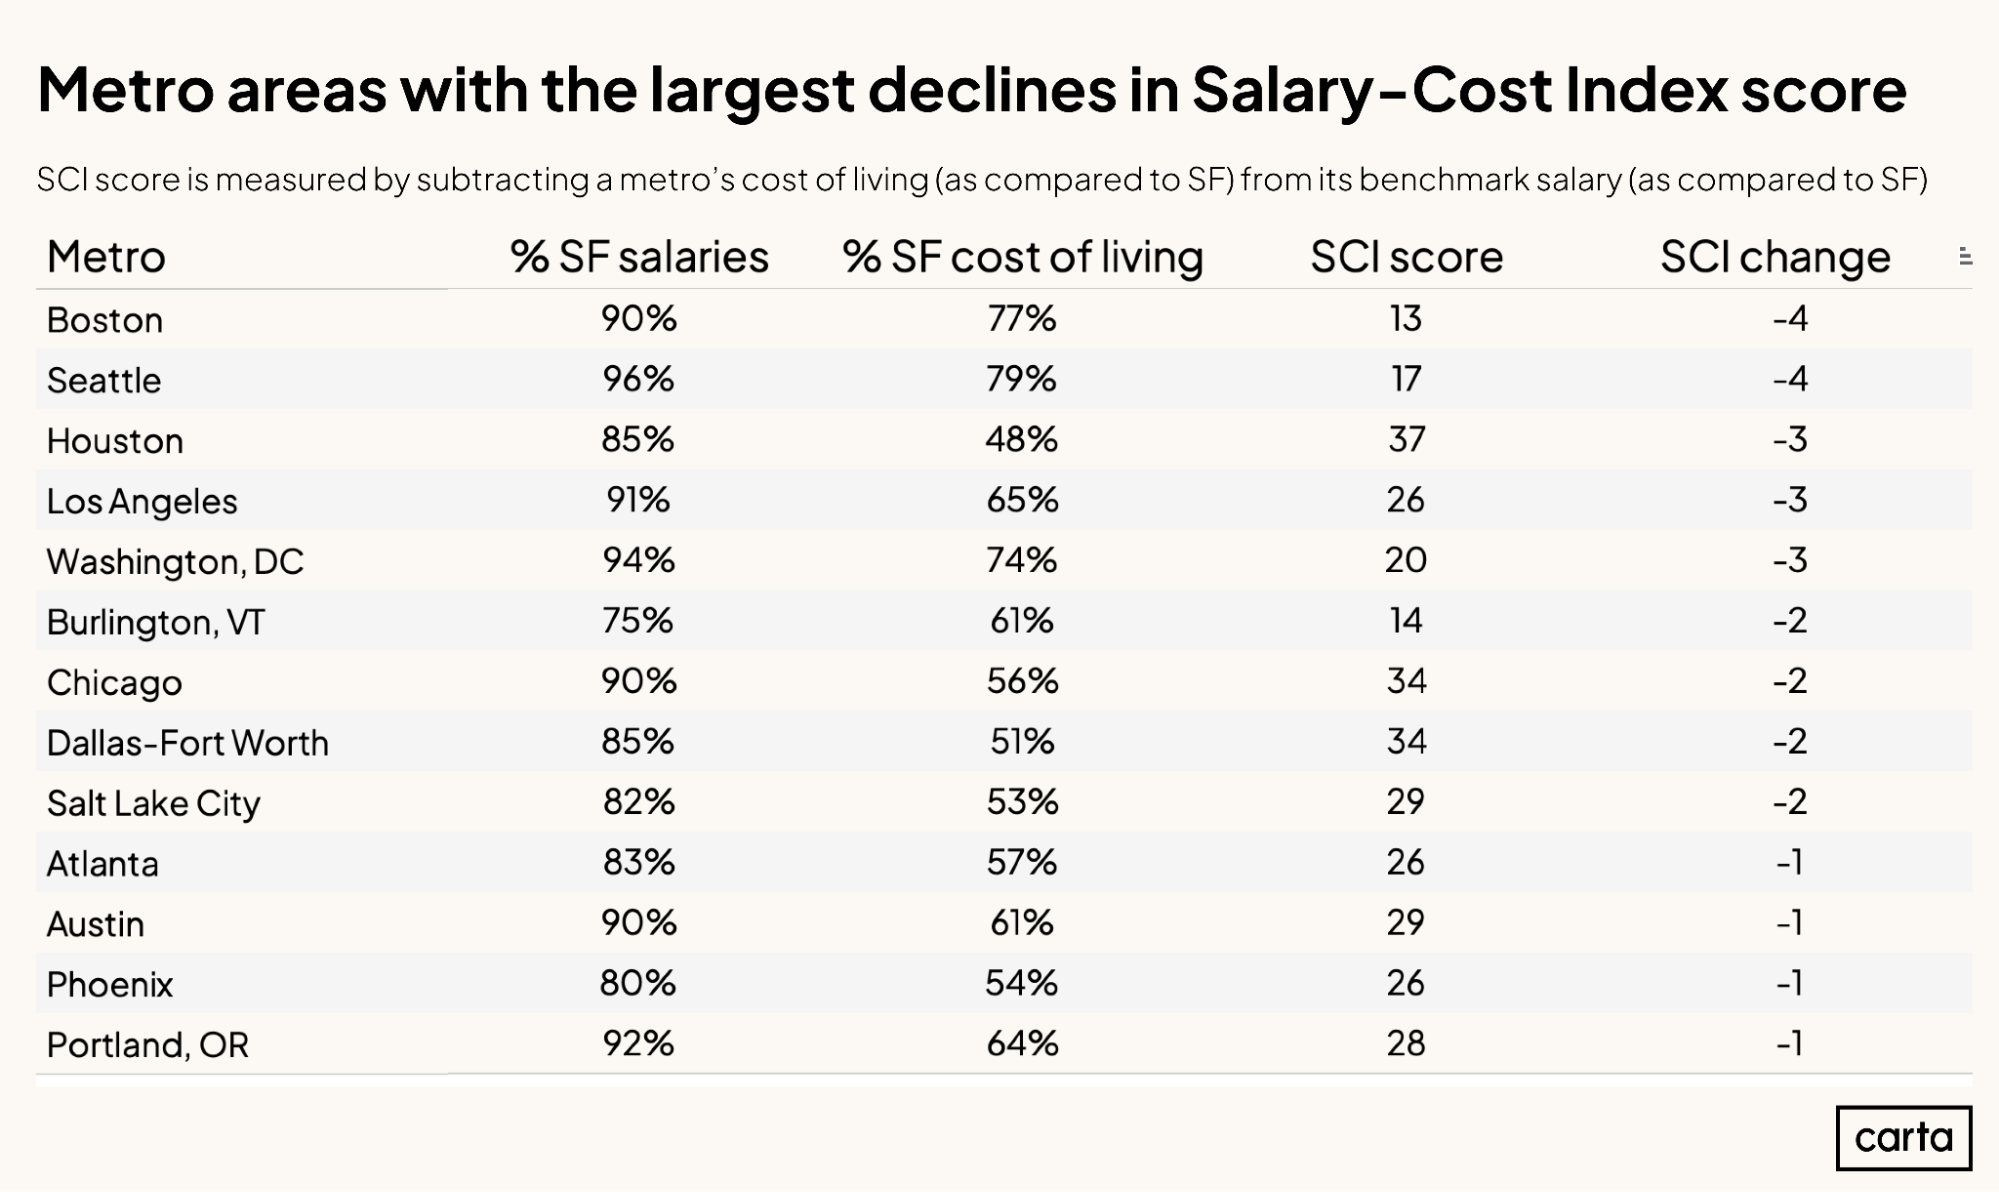
In terms of metro area size, this is a very different list. The average population of these metros with declining SCI scores is about 5.2 million. The average population of the metros with increasing SCI scores in the previous chart is less than 2 million. Several of the metros on this list are also well-established venture hubs, including the top two names, Boston and Seattle.
These shrinking SCI scores are due to shifts in the salary market. Relative to San Francisco, startup workers in cities like Boston, Seattle, Houston, and Los Angeles are earning less than they did last year.
During the first six months of 2023, larger metros with mature VC markets were more likely to have declining SCI scores. Smaller metros with less-developed VC scenes were more likely to have increasing scores. In other words: Many smaller metros seem to be growing more affordable for startup workers in relation to San Francisco, while many larger metros are growing less affordable.
The full list
Download the full list of 50 metro areas, ranked in order from the lowest SCI score to the highest:
Methodology
SCI score relies on median income and rent data from the U.S. Census Bureau and family budget estimates from the Economic Policy Institute, a nonprofit think tank that aims “to include the needs of low- and middle-income workers in economic policy discussions.” These three cost-of-living metrics are broken down by city, while Carta’s base salary data is broken down by metro area. For cost of living, we used the largest city within each metro area. Median household income and median rent are from the five-year span of 2017-2021, the latest available government data, while Carta salary data is from January 2023-June 2023.
DISCLOSURE: This communication is on behalf of eShares Inc., d/b/a Carta Inc. ("Carta"). This communication is for informational purposes only, and contains general information only. Carta is not, by means of this communication, rendering accounting, business, financial, investment, legal, tax, or other professional advice or services. This publication is not a substitute for such professional advice or services nor should it be used as a basis for any decision or action that may affect your business or interests. Before making any decision or taking any action that may affect your business or interests, you should consult a qualified professional advisor. This communication is not intended as a recommendation, offer or solicitation for the purchase or sale of any security. Carta does not assume any liability for reliance on the information provided herein. ©2023 eShares Inc., d/b/a Carta Inc. ("Carta"). All rights reserved. Reproduction prohibited.
